
Accurate BMP/LBPA quantification requires three decisions before samples are collected: choose a biologically appropriate matrix, distinguish BMP from phosphatidylglycerol and positional isomers, and lock matrix-specific normalization and quality-control rules across the cohort.
Bis(monoacylglycero)phosphate (BMP), historically called lysobisphosphatidic acid (LBPA), is enriched in late endosomes and lysosomes. Its abundance and acyl-chain composition can provide a focused readout of endolysosomal lipid handling, but accurate measurement is not achieved by assigning a peak from exact mass alone (Showalter et al., 2020; Dong et al., 2026).
BMP/LBPA Lipidomics Study Design at a Glance
- Matrix selection: Use urine when the study needs repeatable, minimally invasive sampling and a biofluid readout; use tissue when the question concerns local lipid remodeling in a defined organ or experimental model.
- Isomer control: Treat BMP versus phosphatidylglycerol (PG) interference separately from BMP positional-isomer resolution. These are related but different identification problems.
- Reporting level: Decide before analysis whether the endpoint is total BMP, a summed composition such as BMP 42:8, an acyl-resolved molecular species, or a positional isomer such as 2,2′-di-22:6-BMP.
- Cohort quality control: Use matrix-matched extraction assessment, internal-standard tracking, blanks, pooled quality controls, and randomized batch allocation for cohort-scale work.
- Cross-matrix integration: Do not directly combine raw urine and tissue concentrations. Analyze each matrix using its own units and normalization, then integrate effect sizes or paired biological patterns.
Why BMP/LBPA Quantification Requires Study-Level Planning
Bis(monoacylglycero)phosphate (BMP), also known as LBPA, is an anionic phospholipid enriched in late endosomes and lysosomes; accurate quantification requires differentiation from isomeric phosphatidylglycerol (PG). It participates in membrane organization and lipid trafficking within the endolysosomal system. Published tissue mapping also shows that BMP abundance and molecular composition vary substantially among organs, making matrix choice part of the biological hypothesis rather than a logistical detail (Wang et al., 2019).
The analytical difficulty begins with structure. BMP and PG can share the same elemental composition and nominal or exact mass while arranging their acyl groups on different glycerol backbones. In some acquisition modes, they also produce overlapping fragment ions. A peak assigned from precursor mass alone may therefore represent BMP, PG, or an unresolved mixture (Hankin et al., 2015; Vosse et al., 2018).
BMP itself adds another layer of ambiguity. Labels such as 2,2′-, 2,3′-, and 3,3′-BMP describe acyl positions, while labels such as BMP 42:8 describe only the total carbon and double-bond count. These reporting levels are not interchangeable. If the study hypothesis concerns a particular urinary isoform, a class-total assay or sum-composition result cannot answer it.
Define the measurand before selecting the assay
The measurand is the specific quantity the study intends to report. For BMP/LBPA, it may be:
- Total BMP/LBPA across all detected species.
- A species grouped by total carbon and unsaturation, such as BMP 36:2 or BMP 42:8.
- An acyl-resolved species, such as BMP 18:1/18:1.
- A positional isomer, such as 2,2′-di-22:6-BMP.
- A ratio or contextual panel that compares BMP with PG, phosphatidic acid, cardiolipin, sphingolipids, or gangliosides.
This choice determines the need for authentic standards, chromatographic resolution, qualifier ions, calibration models, and contextual lipid measurements. The BMP/LBPA analysis service supports species-resolved targeted measurement with isomer-aware checks and can be scoped around the intended reporting level.
Choosing Urine, Tissue, Cells, or Endolysosomal Fractions for BMP/LBPA Analysis
There is no universally best BMP/LBPA matrix. Urine, tissue, cultured cells, and enriched membrane fractions capture different biological compartments and require different normalization strategies. The strongest design begins with the biological question and then selects the matrix, rather than selecting the easiest available specimen and adapting the hypothesis afterward.
Urine supports longitudinal and cohort-scale sampling
Urine is useful when repeated collection, longitudinal follow-up, or a minimally invasive biofluid readout is central to the study. Large cohort research has measured di-18:1-BMP, di-22:6-BMP, and 2,2′-di-22:6-BMP in urine using internal standards and calibration curves. In one PPMI analysis, the combined genetic and comparison groups exceeded 1,000 participants, demonstrating that targeted urinary BMP measurement can be implemented at cohort scale (Merchant et al., 2023).
Urinary concentration varies with dilution. Creatinine normalization has been used to express BMP as mass per milligram of creatinine, but the normalization method should be prespecified and evaluated rather than applied automatically. In a two-cohort study, creatinine normalization did not change the main group differences because creatinine levels were similar among groups; that result does not guarantee the same behavior in a different population or collection design (Alcalay et al., 2020).
Urine does not provide direct tissue localization. Its BMP signal may reflect secretion, extracellular vesicle release, renal handling, hydration, collection timing, and other biological or preanalytical influences. If the hypothesis concerns a specific organ, urine is best treated as a complementary biofluid endpoint rather than a substitute for tissue measurement.
Tissue provides local biological context
Frozen tissue is preferable when the primary question concerns organ-specific endolysosomal remodeling, a local treatment response, or the relationship between BMP and other lipids in the same tissue. A rodent atlas quantified BMP and PG across 14 organs and found organ-dependent abundance and molecular composition, with comparatively high BMP levels in several lysosome-rich tissues (Wang et al., 2019).
Tissue introduces heterogeneity that urine does not. A whole-tissue extract combines multiple cell types, subcellular compartments, vascular content, and regions. Sampling a consistent anatomical region, recording wet weight, minimizing freeze-thaw cycles, and balancing dissection procedures across groups are therefore essential.
Normalization may use tissue wet weight, protein, DNA, or another measure tied to the study design. These denominators answer different questions. Wet-weight normalization reflects abundance per tissue mass, whereas protein or DNA normalization may better address differences in cellular material. The selected denominator should be recorded before unblinding and applied consistently.
Cells and enriched fractions answer mechanism-focused questions
Cultured-cell studies can connect BMP changes to a defined genetic or pharmacological perturbation. Cell count, total protein, or DNA can provide a loading denominator, but culture density, medium composition, harvest timing, and washing procedures must be matched across groups because they can alter lipid abundance or introduce extracellular lipid carryover.
Endolysosome- or membrane-enriched fractions increase compartment specificity but add variability from fraction yield and purity. These studies require a documented fractionation workflow and a normalization measure that remains meaningful across samples. If enrichment efficiency varies systematically by group, apparent BMP differences may reflect recovery rather than biology.
BMP/LBPA matrix-selection table
| Matrix | Best suited to | Main advantage | Main interpretation risk | Common normalization basis |
|---|---|---|---|---|
| Urine | Longitudinal studies, cohort profiling, biofluid response | Repeatable collection and scalable sampling | Dilution and renal/extracellular-vesicle influences; no direct tissue localization | Volume plus prespecified creatinine or specific-gravity assessment |
| Whole tissue | Organ-specific remodeling and local treatment effects | Direct connection to a defined tissue | Cell-type and regional heterogeneity | Wet weight, protein, or DNA |
| Cultured cells | Genetic perturbation, mechanism, concentration-response studies | Controlled biological system | Cell density, medium, harvest, and washing effects | Cell count, protein, or DNA |
| Enriched endolysosomal or membrane fraction | Subcellular localization and pathway-focused work | Greater compartment specificity | Variable enrichment yield and purity | Protein amount plus fraction-purity metadata |
| Plasma or serum | Exploratory circulating readouts | Existing banked cohorts may be available | Low abundance and uncertain tissue origin | Volume with matrix-specific recovery assessment |
If the study needs repeatable systemic monitoring, choose urine. If it needs tissue-of-action interpretation, choose tissue. If it needs causal mechanism under a controlled perturbation, choose cells or enriched fractions. For multi-matrix studies, define one matrix as the primary endpoint and the others as supporting endpoints.
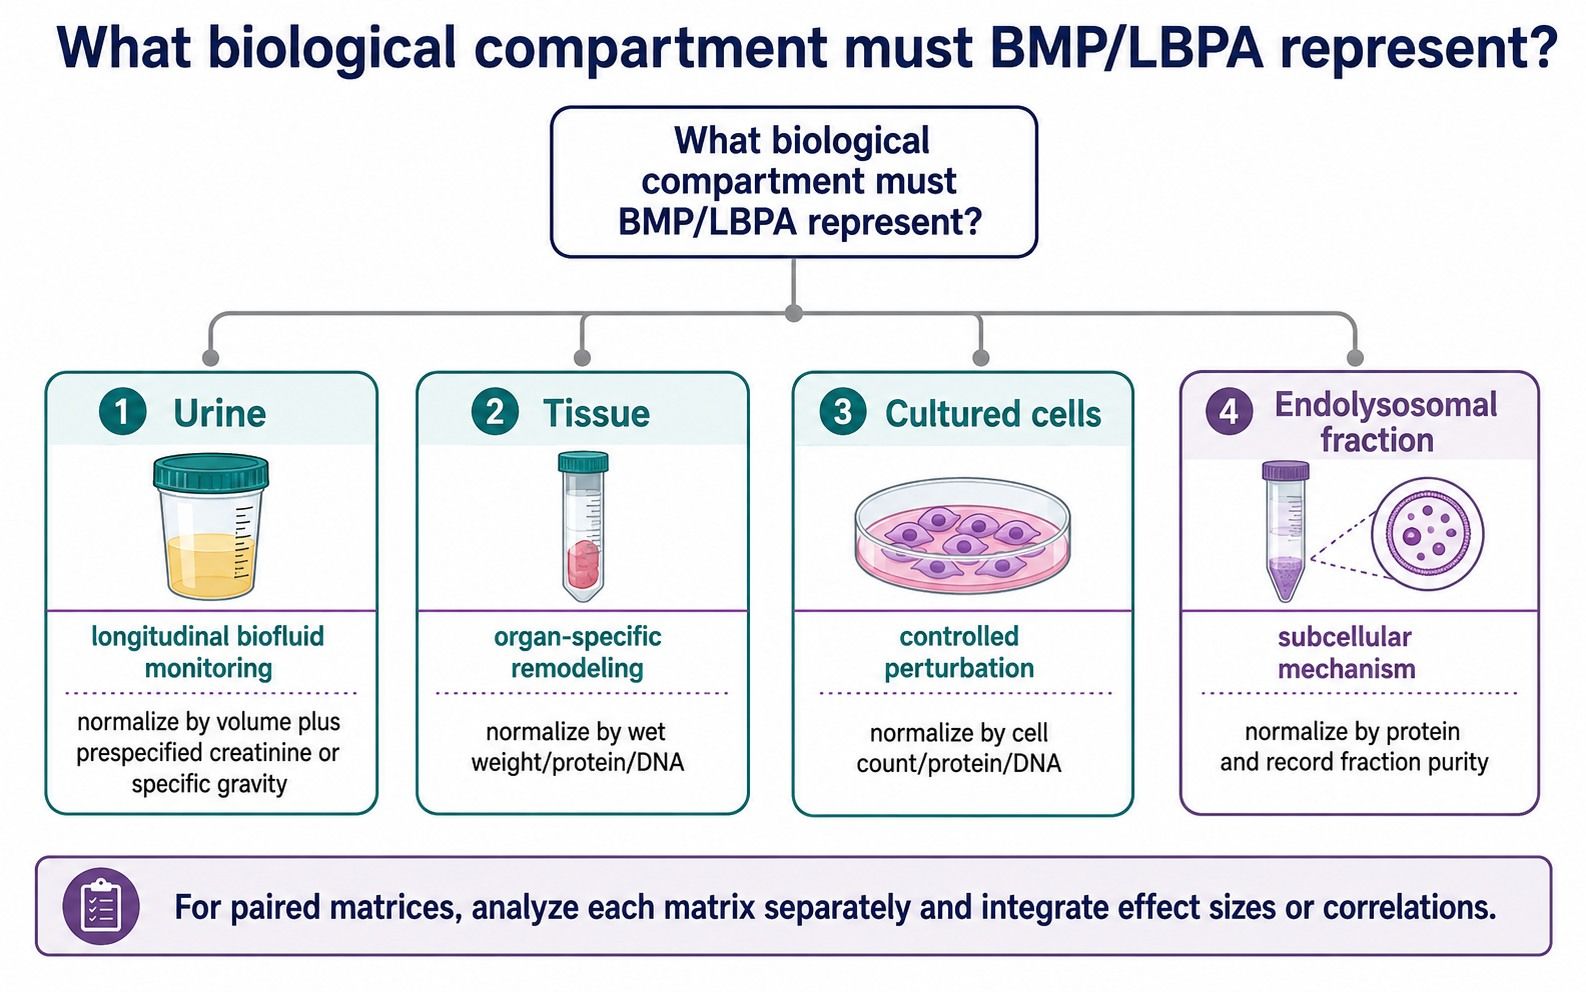 Matrix selection determines what a BMP/LBPA measurement can represent biologically.
How BMP/PG and BMP Positional Isomers Affect Quantification
“Isomer control” can refer to two different analytical challenges. The first is separating BMP from PG. The second is resolving positional forms within the BMP class. A method that addresses only one of these challenges should not be described as universally isomer-resolved.
BMP and PG cannot be distinguished by precursor mass alone
BMP and PG are structural isomers with different biological roles. Negative-ion tandem mass spectra can be insufficient to distinguish them, and exact mass alone cannot establish class identity. Published solutions include chromatographic separation, positive-mode fragmentation behavior, derivatization, and ion-mobility-supported strategies (Hankin et al., 2015; Wang et al., 2017; Dong et al., 2026).
Chromatographic evidence is strongest when retention behavior is established with authentic BMP and PG standards. Qualifier transitions or class-informative fragments provide an additional identity check. In complex tissue extracts, a contextual PG measurement is also valuable because a high-abundance PG signal can increase the consequence of partial coelution or incorrect annotation.
HILIC-MS/MS methods have been used to quantify BMP together with PG, phosphatidic acid, and cardiolipin while correcting isotopic overlap. Other work has used HILIC with high-resolution MS to separate and identify BMP and PG in cellular lipid extracts (Scherer et al., 2010; Vosse et al., 2018). These examples show why chromatographic selectivity and isotope correction should be evaluated as separate components of method performance.
BMP positional isomers require explicit reporting
Within BMP, 2,2′-, 2,3′-, and 3,3′-diacyl forms differ in acyl position. A method reporting “total di-22:6-BMP” may combine positional forms, while a method reporting “2,2′-di-22:6-BMP” claims a more specific structural endpoint. The latter requires evidence that the positional assignment is supported by the analytical method and reference materials.
The study should also distinguish sum composition from molecular species. BMP 42:8 could arise from more than one acyl-chain combination. If the acquisition and standards support only total carbon and double-bond annotation, the report should remain at that level rather than implying exact acyl positions.
Evidence needed at each identification level
| Reporting claim | Minimum evidence to plan for | What should not be inferred |
|---|---|---|
| BMP class total | Class-selective separation or validated class-specific response | Individual species or positional-isomer changes |
| BMP 42:8 sum composition | Precursor, retention behavior, and supporting fragment/transition evidence | A unique fatty-acyl pairing |
| BMP 18:1/18:1 molecular species | Acyl-supporting MS/MS evidence and suitable reference behavior | 2,2′ versus 2,3′ versus 3,3′ position unless resolved |
| 2,2′-di-22:6-BMP | Positional-isomer-selective method with appropriate standard or validated assignment | Equivalence to total di-22:6-BMP |
| BMP versus PG comparison | Demonstrated separation or orthogonal structural evidence for both classes | Correct assignment from exact mass alone |
For a study centered on class-level lysosomal remodeling, sum-composition reporting may be sufficient. For a hypothesis built around a named urinary isoform, select an assay that validates that exact positional endpoint.
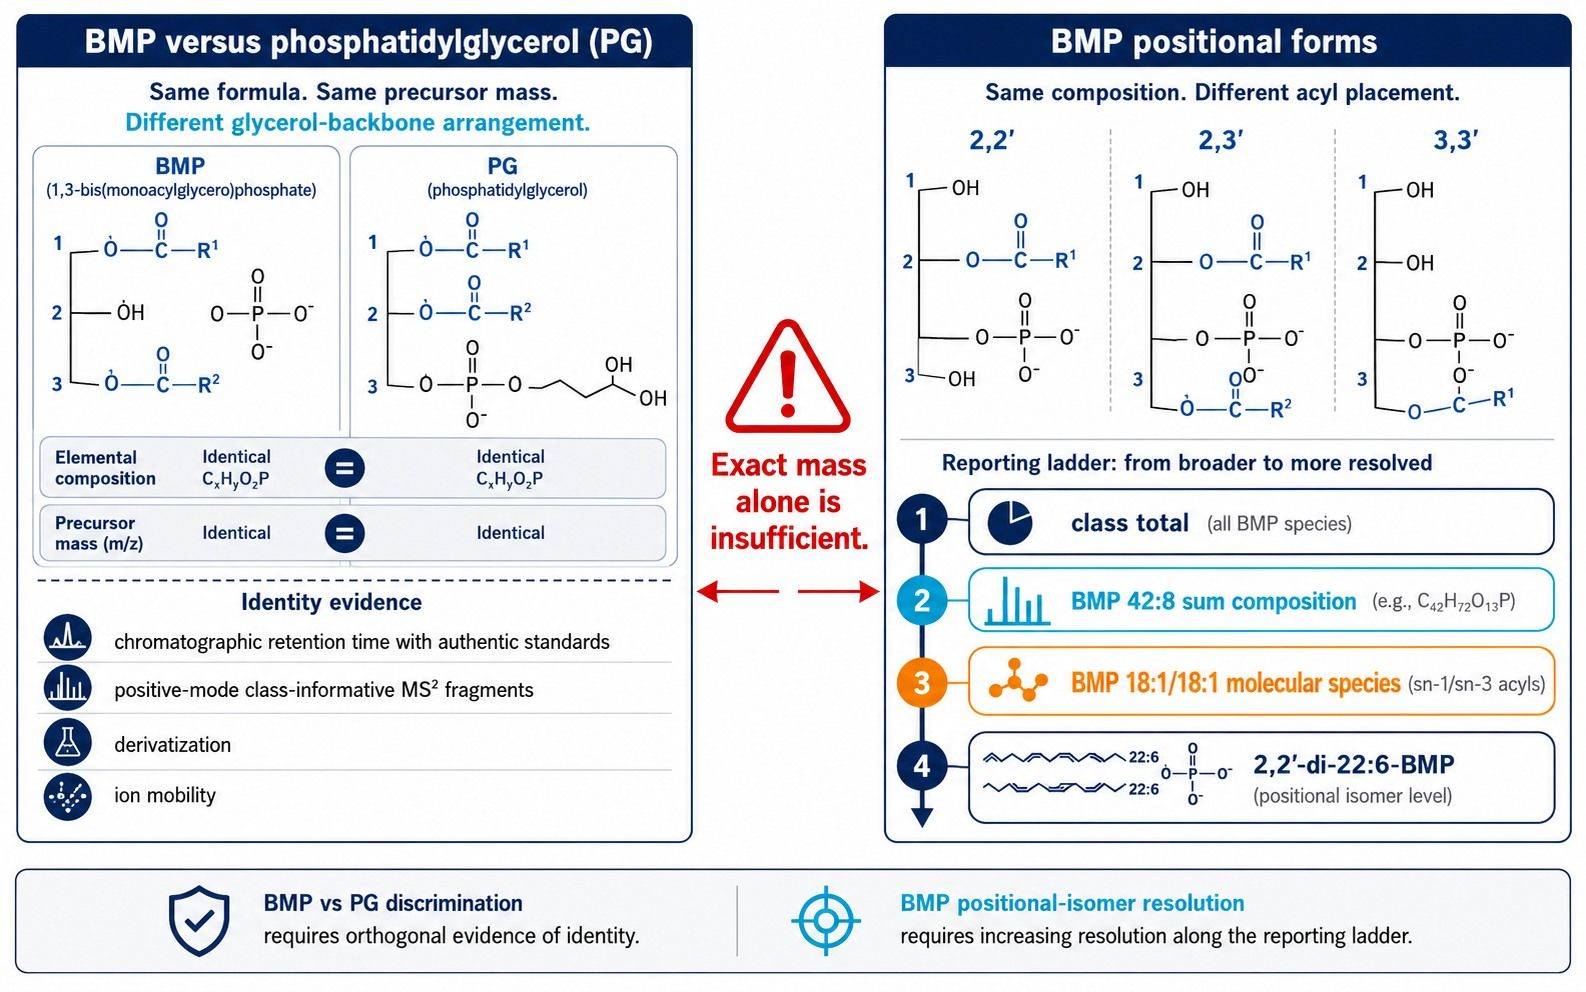 BMP/PG discrimination and BMP positional-isomer resolution require different evidence.
Targeted LC-MS/MS Strategy for Quantitative BMP/LBPA Results
BMP/LBPA is commonly a low-abundance target embedded in a much larger phospholipid background. Untargeted lipidomics can reveal broader lipid remodeling, but targeted LC-MS/MS is usually better suited when the study requires a prespecified BMP panel, calibration, lower-level detection, or positional-isomer reporting. The distinction between discovery and targeted analysis is summarized in the resource on methods of lipidomics analysis.
Choose relative, semiquantitative, or absolute reporting deliberately
Relative abundance can support within-study group comparisons when extraction, ionization, and batch behavior are adequately controlled. Semiquantitative results use a class-matched or surrogate internal standard but may not establish analyte-specific concentration accuracy for every species. Absolute quantification requires calibrators and a validated relationship between response and concentration for the stated analyte and matrix.
The reporting unit should match the biological question. Urine may be reported as concentration and as a dilution-normalized value. Tissue may be reported per milligram of wet tissue, protein, or DNA. Cell studies may use abundance per cell count or per protein. Switching denominators after observing group differences creates avoidable analytical flexibility.
Internal standards must control the relevant sources of variation
An internal standard added before extraction can track extraction loss, preparation variability, and ionization changes more effectively than an injection standard added immediately before analysis. The closest structurally and isotopically matched standard is generally preferable, but practical panels may use validated class-specific surrogates for species without matched labeled analogs.
The study plan should document which BMP analytes use a matched standard and which rely on a surrogate. It should also assess whether the response relationship remains appropriate across chain lengths, unsaturation levels, matrices, and concentration ranges. The Lipidomics Standards Initiative emphasizes internal standards, matrix effects, blanks, carryover, and analyte stability as core reporting elements for lipidomic quantification (Kopczynski et al., 2024).
Calibration and validation must be matrix aware
Endogenous BMP complicates preparation of a truly blank biological matrix. Depending on the assay, calibration may use a surrogate matrix, background subtraction, standard addition, or another validated strategy. The chosen approach should be tested for selectivity, response behavior, recovery, matrix effect, carryover, dilution integrity, precision, and stability in each matrix used in the cohort.
A urine method cannot be assumed to perform identically in liver, brain, cultured cells, or enriched membranes. Matrix-specific extraction recovery and ion suppression can change the analyte-to-standard response. Multi-matrix projects should therefore use matrix-specific qualification even when the same instrument method and analyte panel are retained.
Creative Proteomics' targeted lipidomics service can be combined with a BMP-focused panel when a project requires calibrated target measurements alongside other lipid classes. For studies that need PG, PA, cardiolipin, or broader membrane-lipid context, a phospholipid analysis strategy can help distinguish an isolated BMP change from wider anionic-lipid remodeling.
Designing a Multi-Matrix or Multi-Batch BMP/LBPA Cohort
Large BMP/LBPA studies should be designed as analytical cohorts, not as a series of unrelated sample submissions. Collection, storage, extraction, batch allocation, normalization, and statistical endpoints must be fixed before analysis. This is especially important when expected biological differences are smaller than the potential variation introduced by matrices or batches.
Start with a matrix-specific pilot
A pilot should establish detectability, the proportion of samples above the reporting limit, approximate variance, matrix effects, and the suitability of the proposed normalization denominator. It should include representative low and high sample amounts, all planned matrices, major biological groups, and any collection sites.
Pilot results can then support power calculations and panel refinement. Species that are consistently below the reporting limit should not remain primary endpoints simply because they are biologically interesting. Conversely, a stable, detectable species may be a useful secondary endpoint even when it was not the original focus.
Randomize without breaking biological balance
Samples should be randomized across extraction plates and acquisition batches while balancing key variables such as treatment group, genotype, sex, collection site, time point, and matrix. Longitudinal samples from the same experimental subject may benefit from being kept within the same batch when feasible, but this constraint must not cause an entire group or time point to occupy one batch.
Analytical staff should receive coded sample identifiers when blinding is feasible. Reruns and repeat preparations should be tracked rather than silently replacing original measurements. The data table should preserve batch, plate, extraction date, injection order, freeze-thaw count, and deviation flags.
Use several types of blanks and quality controls
Solvent blanks monitor instrument background and carryover. Extraction blanks reveal lipids or contaminants introduced by tubes, solvents, and preparation materials. Internal-standard blanks help identify signals arising from standard mixtures. These controls answer different questions and should not be collapsed into a single “blank” category.
Pooled matrix quality controls can monitor repeatability and drift across a batch. For multi-matrix studies, a pooled urine QC does not substitute for a pooled tissue QC because the extraction background and ionization environment differ. When sample volume prevents a pooled study QC, a characterized surrogate or long-term reference can support performance monitoring, but its limitations should be documented.
Predefine normalization and statistical endpoints
Normalization should address sample loading without erasing biological variation. Urinary creatinine can help account for dilution, but both raw concentration and normalized results may be informative. Tissue wet weight, protein, and DNA are not interchangeable, and the selected measure should reflect the biological unit of interest.
For paired urine and tissue studies, analyze each matrix on its native scale. The integrative analysis can compare within-matrix standardized effects, correlations, longitudinal trajectories, or response categories. Raw ng/mL urine values and pmol/mg tissue values should not be concatenated into a single abundance matrix.
The lipidomics bioinformation analysis service can support prespecified group comparisons, covariate models, species-pattern summaries, and integration with project metadata. Statistical planning should occur before group labels are unblinded so that filtering, transformations, missing-value rules, and multiplicity control do not shift in response to the observed result.
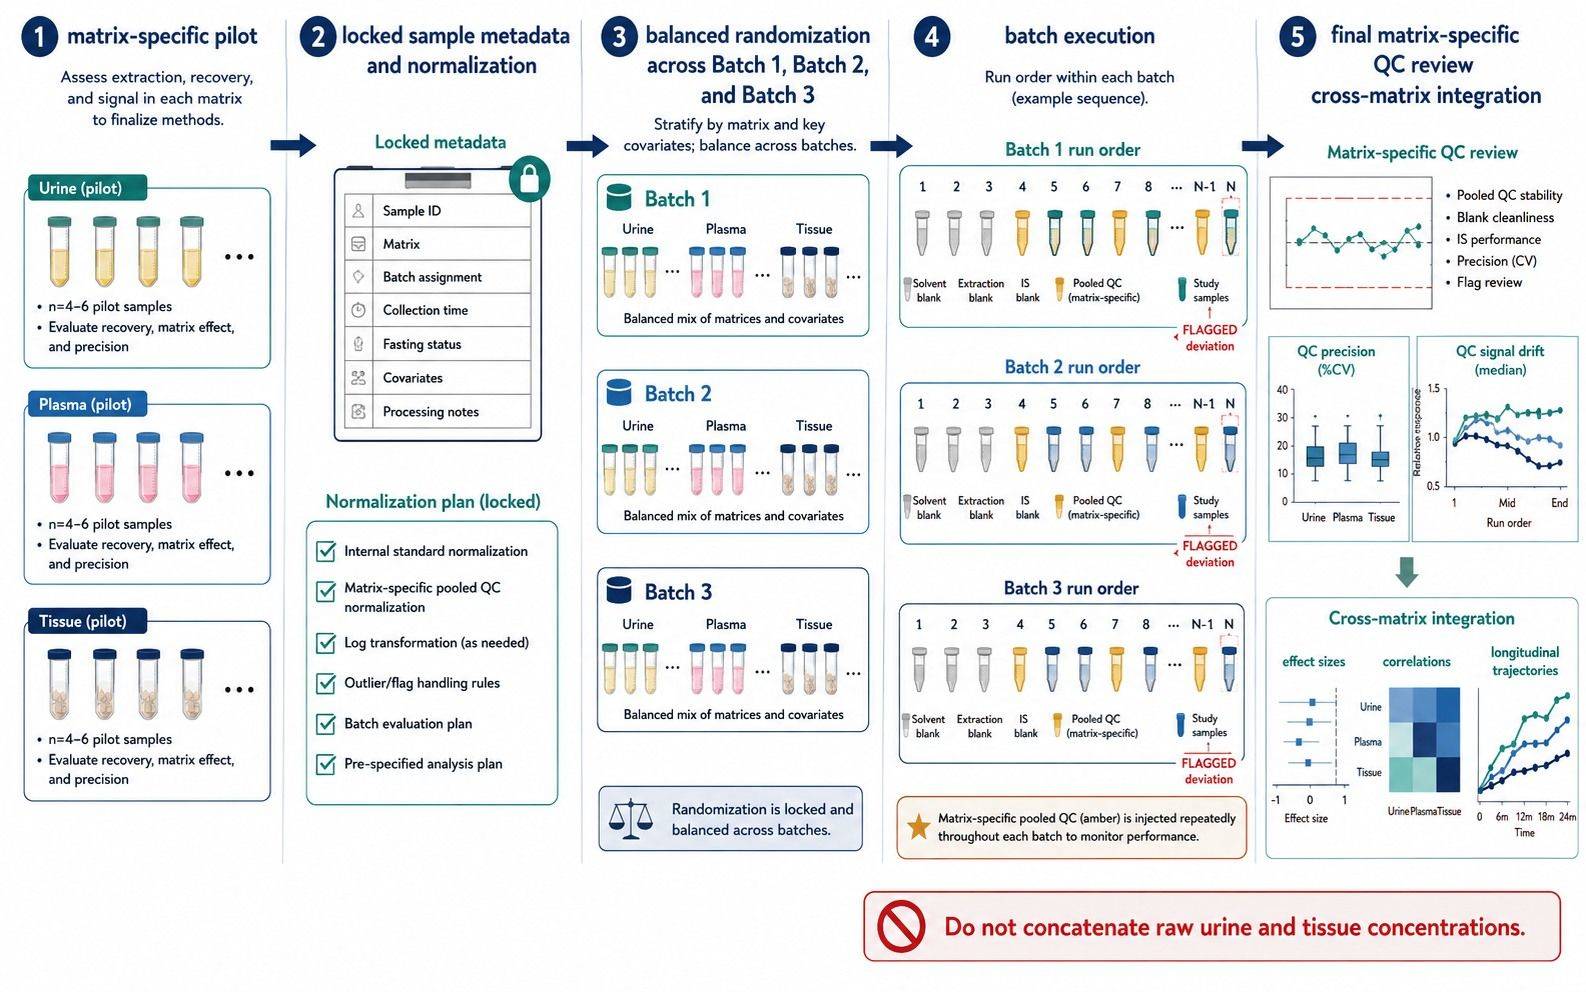 Cohort-scale BMP/LBPA analysis requires balanced batches and matrix-specific quality controls.
Common BMP/LBPA Cohort Design Errors
| Design error | Why it matters | Better approach |
|---|---|---|
| Treating exact mass as proof of BMP identity | PG can share the same composition and mass | Require chromatographic or orthogonal structural evidence |
| Using “BMP 42:8” and “2,2′-di-22:6-BMP” interchangeably | They describe different structural certainty | Prespecify and report the supported annotation level |
| Applying one calibration model to every matrix without qualification | Recovery and ion suppression can be matrix dependent | Evaluate calibration and QC performance by matrix |
| Normalizing urine only after group differences are seen | Post hoc denominator choice can change interpretation | Prespecify raw and normalized endpoints |
| Placing all controls or all cases in one batch | Biological group becomes confounded with analytical batch | Balance groups and covariates across batches |
| Using one pooled QC for urine and tissue | A QC from one matrix cannot represent another matrix | Prepare matrix-specific pooled or surrogate controls |
| Combining urine and tissue concentrations directly | Units and biological sources differ | Integrate effect sizes, trajectories, or correlations |
| Measuring BMP alone when PG interference is plausible | A shift may reflect misassignment or broader lipid remodeling | Add PG and selected contextual anionic lipids |
BMP/LBPA Study Design Decision Framework
Use the following sequence before requesting analysis:
- Define the biological compartment. Decide whether the primary question concerns a longitudinal biofluid signal, a tissue-of-action response, a cellular mechanism, or an enriched endolysosomal fraction.
- Define the reporting level. Select class total, sum composition, molecular species, or positional isomer. Do not request more structural detail than the hypothesis requires.
- Select the quantification level. Decide whether within-study relative change is sufficient or whether calibrated absolute concentrations are necessary.
- Identify the main interferences. Include PG and other contextual anionic lipids when they affect identification or biological interpretation.
- Lock the denominator. Prespecify urine dilution adjustment, tissue mass, protein, DNA, or cell count before analysis.
- Qualify every matrix. Confirm recovery, matrix effect, reporting range, stability, and QC material for urine, tissue, cells, or fractions separately.
- Build the batch map. Balance biological groups and covariates across extraction and acquisition batches, with matrix-specific pooled QCs and blanks.
- Predefine integration. For multi-matrix studies, specify whether integration will use correlations, effect sizes, longitudinal responses, or pathway-level patterns.
If the project asks whether BMP changes systemically over time, prioritize urine with a prespecified dilution-normalization strategy. If it asks where and how endolysosomal lipid remodeling occurs, prioritize tissue or cells with local loading normalization. If both questions matter, use a paired design but keep the analytical endpoints matrix specific.
Planning BMP/LBPA Analysis with Creative Proteomics
A productive feasibility review starts with the proposed matrix, available amount, number of samples, biological groups, collection schedule, expected BMP species, required reporting level, and planned normalization denominator. Existing pilot data or representative pooled material can help define sensitivity and calibration needs before the full cohort is analyzed.
Creative Proteomics can configure targeted BMP/LBPA measurement with matrix-specific sample preparation, internal-standard-anchored quantification, BMP/PG identity checks, batch quality controls, and optional contextual phospholipid panels. Discuss the cohort design before sample collection when matrix choice, positional-isomer reporting, or multi-batch allocation could affect the scientific endpoint.
FAQs
Are BMP and LBPA the same lipid?
BMP and LBPA are names used for the same lipid class. BMP is the structurally descriptive name commonly used in lipidomics, while LBPA is the historical name. A report should use one primary term and define the synonym once to avoid treating them as separate analytes.
Can untargeted lipidomics accurately quantify BMP/LBPA?
Untargeted lipidomics can detect BMP-like features and provide broad lipid context, but exact mass alone cannot reliably distinguish BMP from PG. If BMP is a primary endpoint, use targeted or specifically validated isomer-aware measurement. Untargeted discovery and targeted confirmation can be complementary.
Can urine and tissue BMP concentrations be compared directly?
No. Urine and tissue values use different units, denominators, and biological sources. Analyze each matrix separately, then compare paired changes, standardized effect sizes, correlations, or response trajectories. A urine concentration should not be interpreted as a direct estimate of tissue BMP abundance.
Which BMP species should be primary endpoints?
Select species based on the biological pathway, matrix detectability, published evidence, and pilot variance. Urinary studies often evaluate di-18:1-BMP, di-22:6-BMP, and selected positional isoforms, but a tissue study may show a different composition. Prespecify a small primary panel and treat broader profiling as secondary analysis.
How should urinary BMP be normalized?
Measure urine BMP concentration and prespecify whether creatinine or specific gravity will be used to address dilution. Evaluate whether the denominator differs across groups or time points, and retain the raw concentration for sensitivity analysis. The best approach depends on the collection design and biological model.
What information is needed to scope a BMP/LBPA cohort?
Provide matrix type, sample amount, sample count, group structure, collection sites and time points, storage history, expected concentration range if known, target BMP species, required isomer resolution, desired units, and normalization metadata. Also identify whether samples must be integrated with PG, cardiolipin, sphingolipid, ganglioside, or other omics data.
References:
- Alcalay, R. N., et al. (2020). Higher urine bis(monoacylglycerol) phosphate levels in LRRK2 G2019S mutation carriers: implications for therapeutic development. Movement Disorders, 35(1), 134–141. https://doi.org/10.1002/mds.27818
- Hankin, J. A., Murphy, R. C., Barkley, R. M., & Gijón, M. A. (2015). Ion mobility and tandem mass spectrometry of phosphatidylglycerol and bis(monoacylglycerol) phosphate (BMP). International Journal of Mass Spectrometry, 378, 255–263. https://doi.org/10.1016/j.ijms.2014.08.026
- Dong, W., Nyame, K., Rawat, E. S., et al. (2026). Robust analytical methods for bis(monoacylglycero)phosphate profiling in health and disease. Nature Protocols. https://doi.org/10.1038/s41596-026-01379-1
- Kopczynski, D., Ejsing, C. S., McDonald, J. G., et al. (2024). The lipidomics reporting checklist: a framework for transparency of lipidomic experiments and repurposing resource data. Journal of Lipid Research, 65(9), 100621. https://doi.org/10.1016/j.jlr.2024.100621
- Merchant, K. M., et al.; Parkinson's Progression Markers Initiative. (2023). LRRK2 and GBA1 variant carriers have higher urinary bis(monoacylglycerol) phosphate concentrations in PPMI cohorts. npj Parkinson's Disease, 9, 30. https://doi.org/10.1038/s41531-023-00468-2
- Scherer, M., Schmitz, G., & Liebisch, G. (2010). Simultaneous quantification of cardiolipin, bis(monoacylglycero)phosphate and their precursors by hydrophilic interaction LC-MS/MS including correction of isotopic overlap. Analytical Chemistry, 82(21), 8794–8799. https://doi.org/10.1021/ac1021826
- Showalter, M. R., et al. (2020). The emerging and diverse roles of bis(monoacylglycero) phosphate lipids in cellular physiology and disease. International Journal of Molecular Sciences, 21(21), 8067. https://doi.org/10.3390/ijms21218067
- Vosse, C., Wienken, C., Cadenas, C., & Hayen, H. (2018). Separation and identification of phospholipids by hydrophilic interaction liquid chromatography coupled to tandem high resolution mass spectrometry with focus on isomeric phosphatidylglycerol and bis(monoacylglycero)phosphate. Journal of Chromatography A, 1565, 105–113. https://doi.org/10.1016/j.chroma.2018.06.039
- Wang, M., Palavicini, J. P., Cseresznye, A., & Han, X. (2017). Strategy for quantitative analysis of isomeric bis(monoacylglycero)phosphate and phosphatidylglycerol species by shotgun lipidomics after one-step methylation. Analytical Chemistry, 89(16), 8490–8495. https://doi.org/10.1021/acs.analchem.7b02058
- Wang, X., Schmitt, M. V., Xu, L., et al. (2019). Quantitative molecular tissue atlas of bis(monoacylglycero)phosphate and phosphatidylglycerol membrane lipids in rodent organs generated by methylation-assisted high-resolution mass spectrometry. Analytica Chimica Acta, 1084, 60–70. https://doi.org/10.1016/j.aca.2019.07.060
Author: CAIMEI LI, Senior Scientist