Measure GlcCer levels across biological matrices
Quantify species-specific GlcCer in plasma, cells, tissues, microbes, and plants using targeted LC–MS/MS.

Elevated or disrupted glucosylceramide (GlcCer) levels can indicate imbalances in sphingolipid metabolism, affecting membrane dynamics, stress responses, and enzyme activity across diverse systems. Creative Proteomics offers targeted and semi-targeted LC–MS/MS assays for accurate GlcCer quantification, tailored to research needs in human, plant, and microbial samples.
Start your project with confidence. Our lipidomics specialists will help configure species panels, advise on matrix-specific prep, and deliver decision-ready reports.
Submit Your Request Now
×


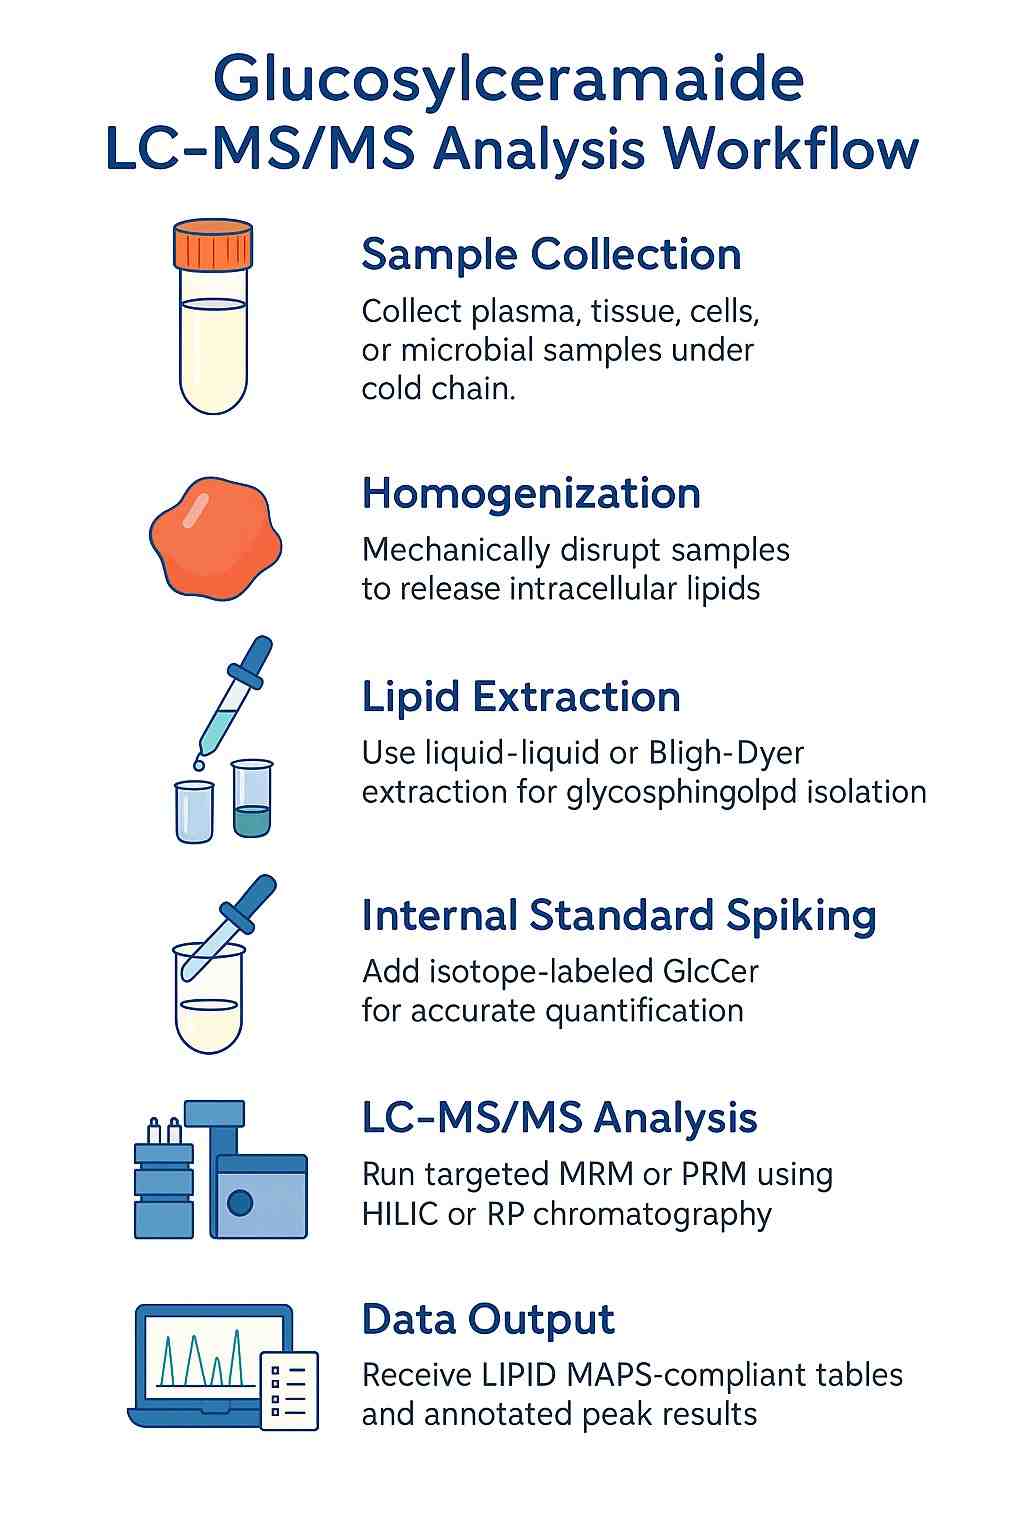
Glucosylceramide (GlcCer), also known as glucocerebroside, is a simple glycosphingolipid formed by the attachment of a glucose molecule to a ceramide backbone. As the primary form of hexosylceramide in many organisms, it plays a central role in lipid homeostasis, membrane microdomain formation, and the biosynthetic pathway toward complex glycosphingolipids such as lactosylceramide (LacCer) and gangliosides.
Structurally, GlcCer species vary based on their sphingoid base and fatty acyl chain lengths, degrees of saturation, and hydroxylation. Standard nomenclature—for example, GlcCer d18:1/24:1—reflects these structural parameters and follows LIPID MAPS classification. These variations influence not only physical membrane properties but also biological signaling and trafficking.
In research contexts, GlcCer quantification is critical for tracing sphingolipid pathway activity, assessing lipid remodeling under stress or disease models, and distinguishing isomeric forms such as galactosylceramide (GalCer) when needed.

Measure GlcCer levels across biological matrices
Quantify species-specific GlcCer in plasma, cells, tissues, microbes, and plants using targeted LC–MS/MS.

Analyze GlcCer changes under stress or treatment
Profile lipid shifts in response to drugs, nutrient deprivation, oxidative stress, or genetic edits.

Differentiate GlcCer from GalCer isomers
Resolve structural isomers for pathway-specific insights, especially in neurobiology or membrane studies.

Evaluate sphingolipid biosynthesis pathways
Track Cer–GlcCer–LacCer transitions to study enzyme function or lipid metabolic flux.

Profile GlcCer in plant stress and development
Monitor glycosphingolipid dynamics in leaves, roots, or cultured cells under environmental change.

Screen GlcCer in fermentation and engineered strains
Detect glycosphingolipid production in microbial systems for quality control or strain optimization.
Our GlcCer analysis covers a broad panel of biologically relevant species, with optional extensions based on your experimental goals. Each species is annotated using LIPID MAPS shorthand and confirmed through validated LC–MS/MS transitions.
Representative GlcCer Species (HexCer, β-Glc only):
| Sphingoid Base / Acyl Chain | Example Notation | Notes |
|---|---|---|
| d18:1/16:0 | GlcCer d18:1/16:0 | Common in mammalian tissues |
| d18:1/18:0 | GlcCer d18:1/18:0 | Frequently studied in neurobiology |
| d18:1/20:0 | GlcCer d18:1/20:0 | Found in plant and microbial systems |
| d18:1/22:0 | GlcCer d18:1/22:0 | Present in immune-related studies |
| d18:1/24:0 | GlcCer d18:1/24:0 | Major long-chain GlcCer species |
| d18:1/24:1 | GlcCer d18:1/24:1 | Monounsaturated variant, membrane-relevant |
| d18:0/24:0 | GlcCer d18:0/24:0 | Saturated base, observed under metabolic shifts |
| t18:0/24:0 | GlcCer t18:0/24:0 | Trihydroxy base; detected in plants |
Isomer Control (Optional):
Custom panels can be designed based on published targets or internal research priorities. We support single-species tracking or broad profiling as required.
Triple Quadrupole (Targeted MRM) — Agilent 6495C
ESI(+) MRM for GlcCer class ions; optimized CE per species; scheduled MRM with dwell time auto-optimization; HILIC-amide or RP-C18 UHPLC (2.1 mm i.d.) with short gradients; internal standard: isotopically labeled GlcCer; RT locks and class-specific qualifiers.
High-Resolution MS (Confirmatory / Semi-Targeted) — Thermo Q Exactive / Orbitrap Exploris 480
ESI(+) PRM or dd-MS2; mass accuracy ≤5 ppm; resolving power ≥60k at m/z 200; stepped-NCE for consistent fragment annotation; full-scan + targeted MS2 for unknown or low-abundance GlcCer variants.
Chromatography Options
Isomer Discrimination (Optional)
Orthogonal strategies for GlcCer vs GalCer: tuned LC selectivity, retention-order markers, and—when required—ion-mobility/DMS screening.
QC & Calibration Essentials
Isotope-dilution calibration, pooled-QC every batch, blank carryover checks, and LIPID MAPS-compliant naming for reporting.
6495C Triple Quadrupole (Figure from Agilent)
Q Exactive (Figure from Thermo Fisher)
Orbitrap Exploris 480 (Figure from Thermo Fisher)
Quantitative Results Table
Chromatograms & Spectra
Calibration & Linearity Summary
LOD/LOQ (Matrix-Matched)
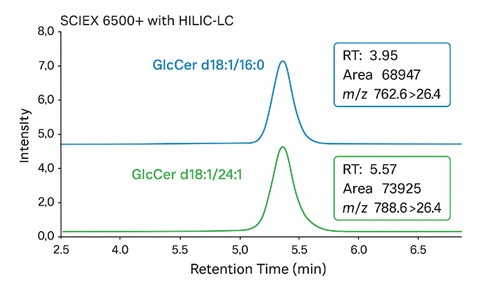
Extracted Ion Chromatograms (EICs)
Representative EICs of GlcCer d18:1/16:0 and d18:1/24:1 acquired by LC–MS/MS (SCIEX 6500+ with HILIC). Species show distinct retention times with clear peak resolution and quantified area under curve.
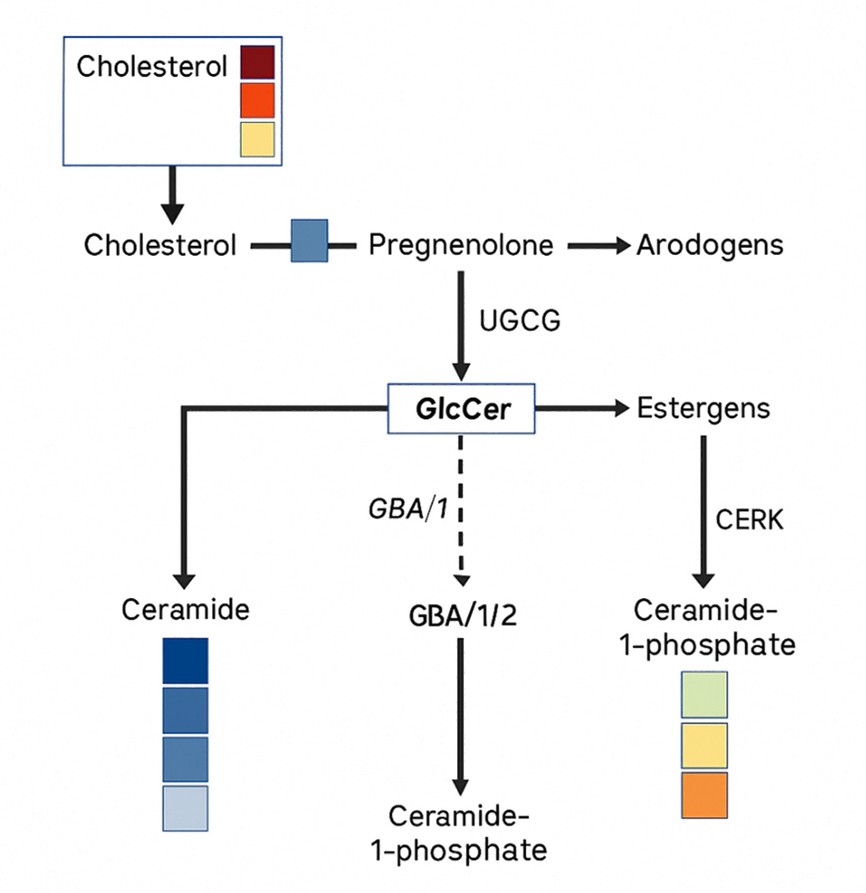
GlcCer-Centered Pathway Overlay with Heatmap
Metabolic pathway map centered on GlcCer with upstream and downstream nodes (Ceramide, Ceramide-1-phosphate) annotated with quantitative heatmaps. Enzymes such as UGCG, GBA, and CERK are indicated.
Lipid Heatmaps & Cluster Plots: Comparative visualization of GlcCer profiles across samples or conditions.
Principal Component Analysis (PCA): Multivariate pattern recognition and sample clustering.
Sphingolipid Pathway Context: Cer–GlcCer–LacCer mapping with optional precursor/product ratios.
Group Comparisons & Fold Change
Explore our Lipidomics Solutions brochure to learn more about our comprehensive lipidomics analysis platform.

Membrane Lipid Remodeling
Track GlcCer alterations linked to changes in membrane fluidity, lipid raft composition, or vesicle trafficking.
Sphingolipid Enzyme Activity Studies
Monitor glucosylceramide synthase (UGCG) or β-glucosidase (GBA) activity by quantifying precursor–product pairs.
Cellular Stress and Apoptosis Models
Evaluate GlcCer accumulation or depletion under oxidative, ER, or nutrient stress to study lipid-mediated signaling.
Plant Glycosphingolipid Research
Profile GlcCer dynamics in roots, leaves, or callus under abiotic stress or during development.
Lipid Flux in Engineered Microbial Strains
Quantify GlcCer levels in fermentation broth to assess glycosphingolipid biosynthesis efficiency or toxicity.
Comparative Lipidomics in Disease Models
Assess GlcCer changes across wild-type and knockout models, treatment groups, or time points in sphingolipid research.
| Sample Type | Recommended Volume / Amount | Container | Preservatives / Additives | Storage Conditions | Shipping Instructions | Special Notes |
|---|---|---|---|---|---|---|
| Plasma / Serum | 150–300 µL | Solvent-safe polypropylene cryovial (screw-cap, O-ring) | Prefer K2-EDTA (plasma). No detergents or glycerol. | −80 °C; avoid repeated freeze–thaw | Dry ice; include sample manifest and matrix details | Record fasting/post-prandial status if relevant; do not hemolyze. |
| Whole Blood | 1–2 mL | EDTA vacutainer → separate plasma quickly | K2-EDTA only; no stabilizers with surfactants | Hold cold, separate plasma promptly; store plasma −80 °C | Ship separated plasma on dry ice | Submit plasma/serum rather than whole blood when possible. |
| Tissue (fresh-frozen) | 30–50 mg (wet weight) | Pre-weighed cryovial, chilled | No salts/detergents; minimal buffer | Snap-freeze; −80 °C; protect from light | Dry ice; keep containers tightly sealed | Note tissue type, region, and preprocessing (e.g., rinsed vs. not). |
| Cell Pellets / Lysates | ≥5 × 10⁶ cells or equivalent lysate | Low-bind, solvent-compatible tube | Lysis without detergents (no SDS/Triton/NP-40); add salts minimally | −80 °C | Dry ice; indicate cell count and buffer | If lysed, provide buffer recipe and protein amount if known. |
| Microbial Cultures (pellets) | Pellet from 10–50 mL culture or 30–50 mg wet pellet | Screw-cap cryovial | No detergents or emulsifiers | −80 °C after rapid chill | Dry ice; include OD/time of harvest | Rinse pellet briefly with cold PBS if media is lipid-rich. |
| Plant Tissue | 50–100 mg (leaf/root/callus) | Foil-wrapped cryovial or amber tube | No extraction solvents added | Snap-freeze; −80 °C; light-protected | Dry ice; minimize headspace | Record species, organ, developmental stage, and treatment. |
| Purified Lipid Extracts (optional) | 50–200 µL extract | Amber glass or PTFE-lined vial | LC-MS–grade solvents (e.g., MeOH/IPA); no water, no surfactants | −20 °C to −80 °C, inert gas headspace recommended | Dry ice; seal caps and parafilm | Provide extraction protocol and any internal standards used. |
General Guidelines:
Avoid detergents, PEG, high salts, and excessive emulsifiers that suppress ionization. If available, note any isotope-labeled GlcCer spiked during extraction; otherwise, we will add internal standards during prep.
How do you distinguish GlcCer from GalCer in complex samples?
We combine class-aware chromatography (HILIC/RP) with targeted MS/MS fragments and, when required, orthogonal ion-mobility (DMS/IMS) to separate epimeric isomers; both cyclic IMS and differential mobility have demonstrated clear GlcCer vs GalCer resolution in practice.
What naming convention appears in my report and why does it matter?
Species are labeled using LIPID MAPS shorthand (e.g., GlcCer d18:1/24:1) so results are interoperable with public tools and literature; this follows community standards for lipid classification and reporting.
When should I choose triple-quad MRM vs Orbitrap HRMS?
MRM on QqQ is preferred for sensitive, routine quantification of predefined GlcCer species, while Orbitrap PRM/dd-MS² supports semi-targeted confirmation and unknowns with sub-ppm accuracy; many standardized lipidomics workflows combine both.
Can results include pathway context rather than isolated numbers?
Yes—reports can map Cer → GlcCer → LacCer with quantitative overlays to support interpretation of UGCG/GBA-related steps and downstream flux, reflecting accepted biology of GlcCer biosynthesis and turnover.
Which chromatographic mode is better for GlcCer: HILIC or RP?
HILIC excels at class separation (e.g., Cer vs HexCer vs Hex2Cer), aiding clean quantification, while RP offers stronger retention for long acyl chains; selection depends on matrix and target list.
What sample handling practices most affect data quality?
Rapid cooling, minimal freeze–thaw, detergent-free buffers, and solvent-compatible plastics reduce ion suppression and preserve lipids; these principles are emphasized across lipidomics best-practice workflows.
Does GlcCer quantification inform functional studies or only profiling?
Quantitative GlcCer readouts can reflect enzymatic activity and membrane remodeling and are routinely integrated with perturbation studies to link lipid changes to mechanism.
Why focus specifically on GlcCer instead of total HexCer?
GlcCer is the principal HexCer precursor to complex GSLs and a sensitive indicator of sphingolipid pathway shifts across tissues, making species-resolved GlcCer metrics more actionable than class totals.

Services:
Online Inquiry
CONTACT US