Our services have earned the trust of companies, schools, and organizations globally,
and we remain dedicated to maintaining that trust.
What Are Omega-6 Fatty Acids and Why Quantify Them?
Linoleic acid is an essential dietary fatty acid, and the n-6 series extends from it through desaturation and
elongation to arachidonic acid, the principal substrate for prostanoid, leukotriene, and epoxygenase
signaling. Individual n-6 species therefore carry two kinds of information: they describe dietary intake and
membrane composition, and they set the size of the precursor pool feeding mediator synthesis. This service
measures the intact n-6 series and its oxidation products in one project, against a panel, chemical form,
and reporting basis fixed before analysis.
Omega-6 Fatty Acid Analysis Services in
Creative Proteomics
The routes below address different parts of the same n-6 question, from intact precursor profiling through
isomer-level resolution to metabolite-level measurement, and can be combined within one study design.
n-6 Precursor Fatty Acid Profiling
Quantify LA, GLA, DGLA, AA, adrenic acid, and osbond acid in plasma, tissue, cells, oils,
dairy, and formulated products by GC-FID, GC-MS, or LC-MS/MS. Results are reported as
percentage of total fatty acids, mass fraction, or concentration, with the denominator
stated per sample.
Free versus Total n-6 Fractionation
The unesterified n-6 pool and the total pool released by hydrolysis are measured as
separate workflows. Free and total values are not interchangeable, so they are never
merged into a single figure without an explicit note.
LA- and AA-Derived Oxylipin Panel
Targeted LC-MS/MS quantification of 20+ oxygenated n-6 metabolites, including 9-HODE,
13-HODE, the EpOME and DiHOME pairs, the 5-, 12-, 15-, and 20-HETE series, 15-HETrE,
EETs, and selected prostanoids and leukotrienes. Isotope-labeled internal standards
correct recovery and matrix effects per analyte.
Conjugated Linoleic Acid Isomer Analysis
Resolve c9,t11-CLA and t10,c12-CLA alongside the broader C18:2 positional and geometric
isomer distribution on a polar capillary column, using low-temperature methylation that
prevents cis-to-trans conversion. Applied to milk fat, ruminant tissue, and
CLA-containing supplements.
Defined Sums and Pathway Ratios
AA/DGLA, LA/AA, adrenic/AA, n-6/n-3, and LA-branch versus AA-branch oxylipin ratios are
calculated only when both terms are measured within one workflow on a consistent basis.
The report lists the contributing species and the calculation basis for each metric.
Detectable Omega-6 Fatty Acids and n-6 Oxylipin
Panels
The omega-6 fatty acid family spans a small number of intact precursor species and a much larger set of
oxidation products. The tables below list the analytes routinely covered; the final panel is confirmed
against the matrix, expected abundance, and reference-standard availability before testing begins.
- Precursor Fatty Acids
- Oxylipin Panels
- Sums & Ratios
n-6 Precursor Fatty Acids and Their
Isomers
The intact n-6 series is quantified as a set, so that each measured species can be placed at a
defined position in the desaturation and elongation sequence rather than reported in isolation.
| Common Name |
Abbreviation |
Lipid Shorthand |
Position in the n-6 Pathway |
| Linoleic acid |
LA |
18:2 n-6 |
Dietary essential precursor and the predominant n-6 species in most matrices
|
| Gamma-linolenic acid |
GLA |
18:3 n-6 |
Delta-6 desaturation product of LA; used to assess desaturase activity |
| Eicosadienoic acid |
EDA |
20:2 n-6 |
Elongation product of LA on the competing elongation branch |
| Dihomo-gamma-linolenic acid |
DGLA |
20:3 n-6 |
Substrate for 1-series prostanoid synthesis and the immediate precursor of AA
|
| Arachidonic acid |
AA (ARA) |
20:4 n-6 |
Principal substrate for prostanoid, leukotriene, and epoxygenase pathways |
| Adrenic acid |
AdA |
22:4 n-6 |
Elongation product of AA; enriched in adrenal, neural, and renal tissue |
| Osbond acid |
— |
22:5 n-6 |
Terminal n-6 elongation and desaturation product; elevated when n-3 availability
is limited |
| Conjugated linoleic acid isomers |
CLA |
18:2 conjugated |
Ruminant- and supplement-derived positional isomers, reported as c9,t11 and
t10,c12 separately |
Depending on the study question, the panel can be extended to the broader unsaturated fatty acid
analysis series, to a defined polyunsaturated fatty acid analysis set, or to a full profile
across all fatty acid classes.
LA- and AA-Derived Oxylipin Panels
Oxygenated n-6 metabolites are grouped by precursor and by enzymatic route, so that a change in
one branch can be distinguished from a change in substrate availability. Where a route matters
to the study design, the corresponding standalone panel is available.
| Oxylipin Class |
Representative Analytes |
Precursor |
Principal Route |
| Hydroxyoctadecadienoic acids |
9-HODE, 13-HODE, 9-oxoODE, 13-oxoODE |
LA |
15-lipoxygenase and non-enzymatic oxidation |
| Epoxyoctadecenoic acids |
9,10-EpOME, 12,13-EpOME |
LA |
Cytochrome P450 epoxygenase |
| Dihydroxyoctadecenoic acids |
9,10-DiHOME, 12,13-DiHOME |
LA |
Soluble epoxide hydrolase acting on EpOMEs |
| Hydroxyeicosatrienoic acid |
15-HETrE |
DGLA |
15-lipoxygenase |
| Hydroxyeicosatetraenoic acids |
5-HETE, 12-HETE, 15-HETE, 20-HETE |
AA |
Lipoxygenase and CYP450 omega-hydroxylation |
| Epoxyeicosatrienoic acids |
5,6-EET, 8,9-EET, 11,12-EET, 14,15-EET |
AA |
Cytochrome P450 epoxygenase |
| Dihydroxyeicosatrienoic acids |
11,12-DiHETrE, 14,15-DiHETrE |
AA |
Soluble epoxide hydrolase acting on EETs |
| Prostanoids |
PGE2, PGD2, PGF2alpha, TXB2 |
AA |
Cyclooxygenase-1 and cyclooxygenase-2 |
| Leukotrienes |
LTB4, LTC4, LTE4 |
AA |
5-lipoxygenase |
Route-specific panels are available where a single enzymatic branch is the study endpoint: hydroxyeicosatetraenoic
acid analysis for the LOX and omega-hydroxylation products, and epoxyeicosatrienoic acid analysis for the epoxygenase branch and
its hydrolysis products.
Reported Sums, Ratios, and Pathway Indices
Sums and ratios are reported as defined metrics rather than as derived values of unknown
composition. Every entry below states which species contribute and on what basis the calculation
is made.
| Metric |
Definition |
Calculation Basis |
| Total n-6 fatty acids |
Sum of all measured n-6 species in the panel |
Reported as percentage of total fatty acids, mass fraction, or concentration,
with contributing species listed |
| n-6/n-3 ratio |
Summed n-6 species relative to summed n-3 species |
Both sums are measured in the same derivatization or extraction workflow and
expressed on one basis |
| AA/DGLA ratio |
Arachidonic acid relative to dihomo-gamma-linolenic acid |
An index of delta-5 desaturase activity and of the balance between the two
eicosanoid precursor pools |
| LA/AA ratio |
Linoleic acid relative to arachidonic acid |
Describes the relationship between the dietary precursor and its principal
downstream substrate |
| Adrenic/AA ratio |
Adrenic acid relative to arachidonic acid |
An elongation index for tissues in which adrenic acid accumulates, such as
adrenal gland and brain |
| EpOME/DiHOME ratio |
Summed epoxyoctadecenoic acids relative to their dihydroxy metabolites |
Widely used as an index of soluble epoxide hydrolase activity within the LA
branch |
| LA-branch/AA-branch oxylipin ratio |
Summed octadecanoids relative to summed eicosanoids |
Describes the shift between the two oxidation branches of n-6 mediator synthesis
|
Why Choose Our Omega-6 Analysis Platform
- Isomer-resolved quantification: A polar capillary GC column separates positional and
geometric C18:2 isomers, including c9,t11- and t10,c12-CLA, which share the same nominal
mass. Methylation runs at room temperature, so cis-to-trans conversion does not occur during
derivatization.
- Oxidation-controlled LA handling: LA predominates among polyunsaturated fatty acids in most
matrices and oxidizes readily ex vivo. Extraction runs under nitrogen with antioxidant
stabilization, and extracts are held in amber vials below minus 70 degrees Celsius, so HODE,
EpOME, and DiHOME values describe the sample.
- Ratios with a stated basis: Every ratio uses only analytes measured in one workflow on one
basis. Contributing species and the denominator appear in the report, so a value can be
compared with published data rather than only within the study.
- Defined acceptance criteria: Calibration linearity of r-squared 0.995 or better, intra-day
precision below 5 percent at mid and upper levels, and intra- and inter-day precision within
15 percent for low-abundance oxylipins, set per matrix during method planning.
- Precursor and metabolite from one batch: The intact n-6 fatty acids and their oxidized
products can be measured from a single extraction batch, so precursor and product data share
sample identity, storage history, and reporting basis.
- Matrices beyond plasma: Methods are validated for plasma, serum, whole blood, erythrocytes,
tissue, cultured cells, oils, dairy, feeds, and formulated products. Each new matrix is
evaluated for extraction recovery before the panel is fixed.
- Limitations reported, not summarized away: Peak integration boundaries, internal-standard
responses, observed matrix effects, and any qualified or excluded results are provided with
the data.
Omega-6 Fatty Acid Analysis Workflow
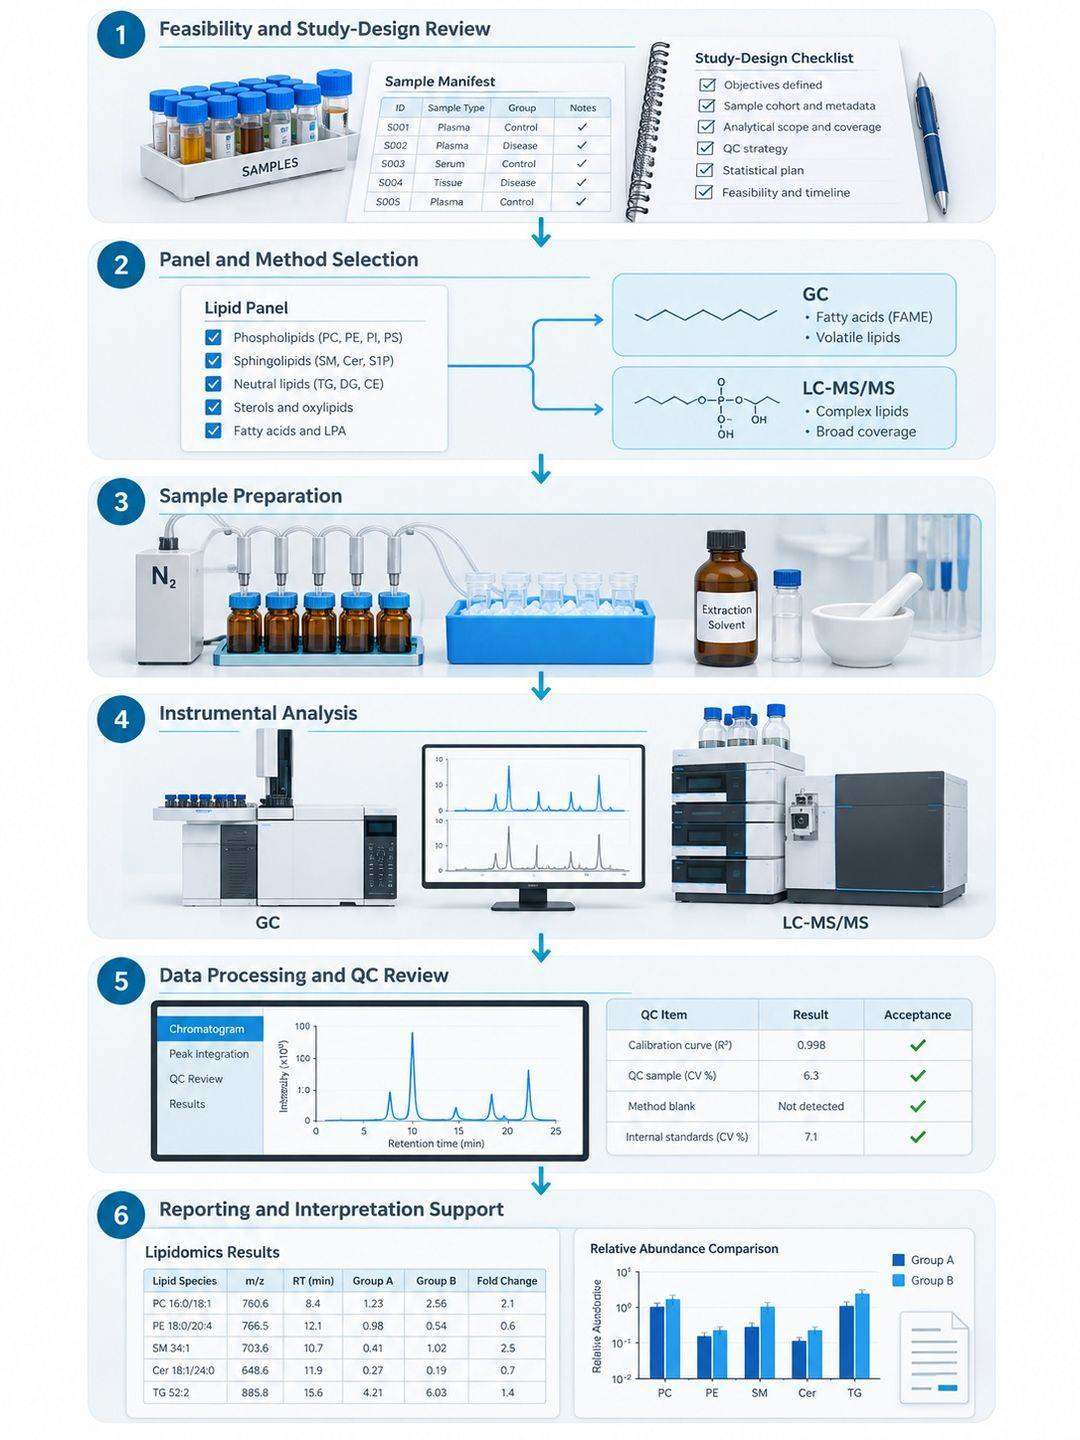 Six-step omega-6 analysis workflow: feasibility and study-design review, panel and method selection, matrix-specific sample preparation, instrumental analysis, data processing and QC review, and reporting with interpretation support.
The workflow is modular rather than fixed. An oil or dairy project rests mainly on representative sampling,
FAME conversion, and column resolution; a plasma or tissue study rests more on collection consistency,
storage history, hydrolysis choice, isotope labeling, and matrix effects. In both cases the pre-analytical
chemistry and the reporting basis are settled before data generation starts.
Platforms Used for Omega-6 Fatty Acid Analysis
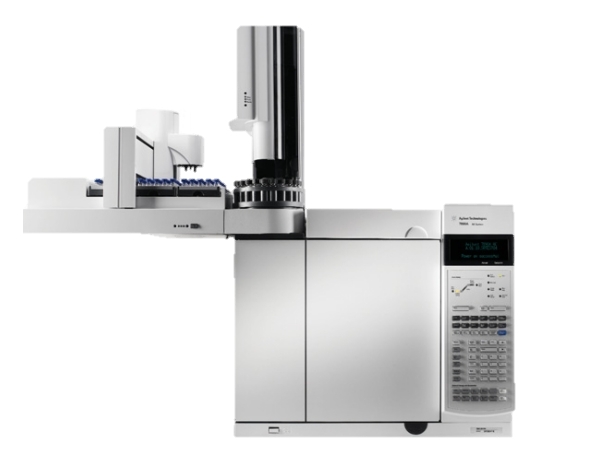
Agilent 7890A GC System (Figure from Agilent) — fatty acid methyl ester separation
with flame ionization detection
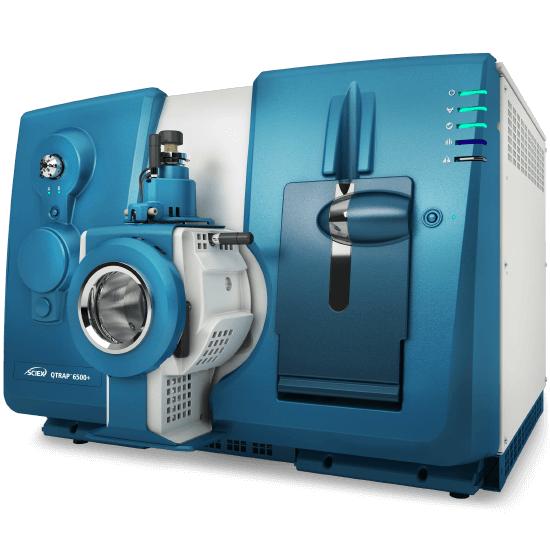
SCIEX Triple Quad 6500+ (Figure from SCIEX) — scheduled MRM for intact n-6 fatty
acids and their oxygenated metabolites
Method Specifications for Omega-6 Fatty Acid Analysis
| Parameter |
Specification |
| Derivatization |
Fatty acid methyl esters with acetyl chloride in methanol for GC routes; intact fatty
acids and oxylipins on LC-MS/MS require no derivatization |
| GC separation |
Polar capillary column with a cyanopropyl stationary phase, 17 to 20 minute
programmed-temperature run, resolving positional and geometric C18:2 isomers |
| GC detection |
Flame ionization detection for relative composition; single quadrupole SIM where
identification support is required |
| LC separation |
Reversed-phase C18 with gradient elution, separately optimized for intact fatty acids
and for oxygenated metabolites |
| Ionization |
Electrospray ionization in negative ion mode for free fatty acids and oxylipins |
| Acquisition mode |
Scheduled multiple reaction monitoring with isotope-labeled internal standards assigned
per analyte |
| Isomer resolution |
c9,t11- and t10,c12-CLA are resolved chromatographically; low-temperature methylation
prevents cis-to-trans conversion during derivatization |
| Oxidation control |
Nitrogen-atmosphere extraction with antioxidant stabilization; amber vials below minus
70 degrees Celsius; HODE and EpOME monitored in blanks and QC samples of every batch
|
| Calibration |
Stable isotope dilution with calibration linearity r-squared of 0.995 or better across
the working range |
| Precision |
Intra-day coefficient of variation below 5 percent at mid and upper calibration levels;
intra- and inter-day precision within 15 percent for low-abundance oxylipins |
| Reporting basis |
Percentage of total fatty acids, mass fraction, molar amount, or absolute concentration,
with the denominator stated per sample |
Where a single method must cover all fatty acid classes rather than the n-6 series alone, the workflow is
aligned with our fatty acid
profiling by GC-FID and GC-MS platform; the total-composition route follows the derivatization
scheme described for fatty acid
methyl ester analysis, so composition data and free-pool data can be placed side by side without
changing the reporting basis.
Results and Data Analysis
Comprehensive Omega-6 Profiling Report
The core report organizes the intact n-6 fatty acids, the oxylipin panel, and the derived ratios
in separate tables that share sample identifiers and units, together with the method notes
needed to interpret them.
Key Features:
- Species-level results for LA, GLA, DGLA, AA, adrenic acid, osbond acid, and CLA isomers,
with the calibration curve and calculation basis for each
- Oxylipin results grouped by precursor and enzymatic route, with isotope-labeled internal
standard response recorded per analyte
- A QC summary covering calibration performance, blank observations, internal-standard
behavior, replicate agreement, and any qualified results
- Method notes describing extraction, derivatization or hydrolysis, chromatographic
conditions, and the reporting basis actually used
Raw instrument files can be discussed during project planning when they are required for
archiving or independent review.
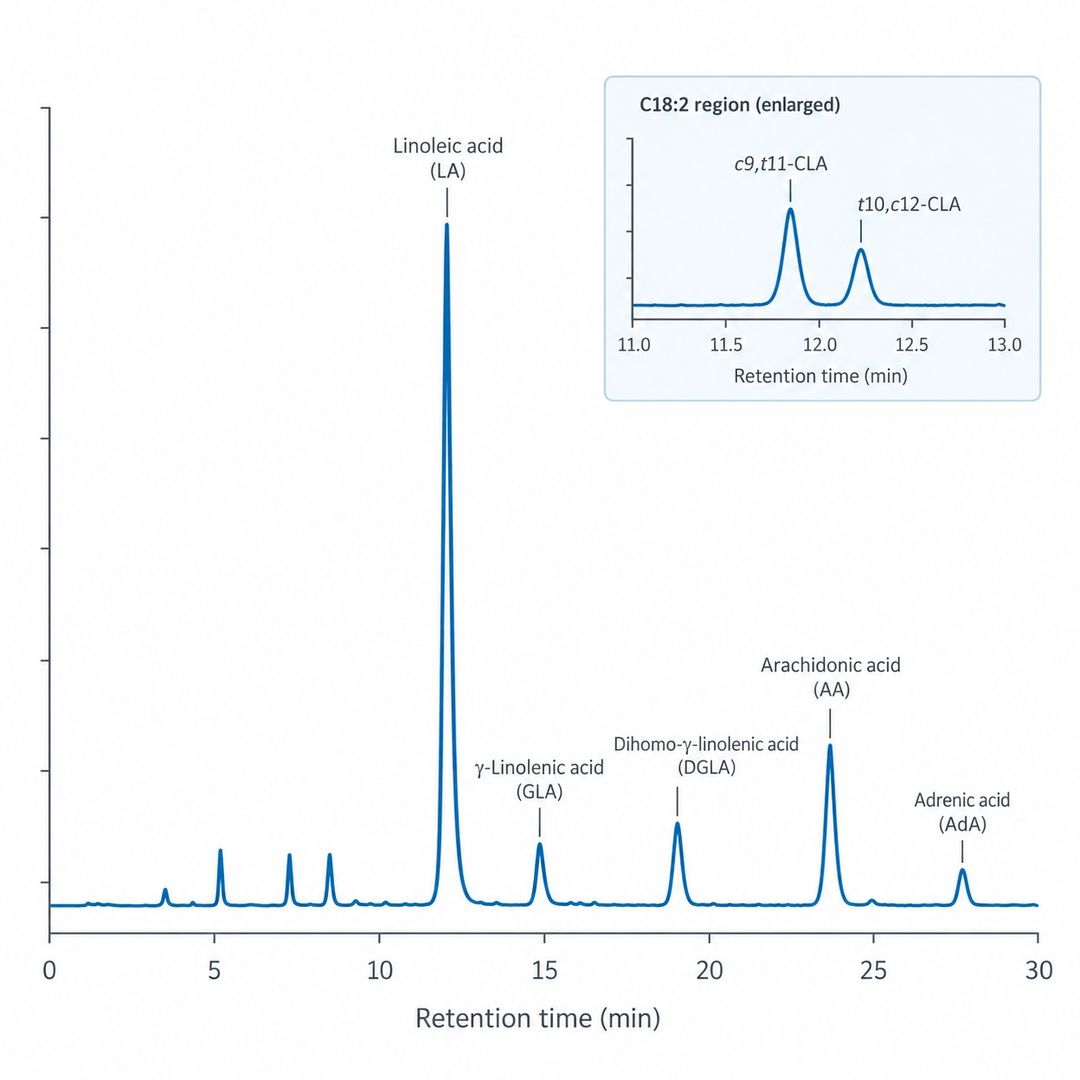
Representative GC-FID separation of n-6 fatty acid methyl esters with LA, GLA, DGLA,
AA, and adrenic acid annotated.
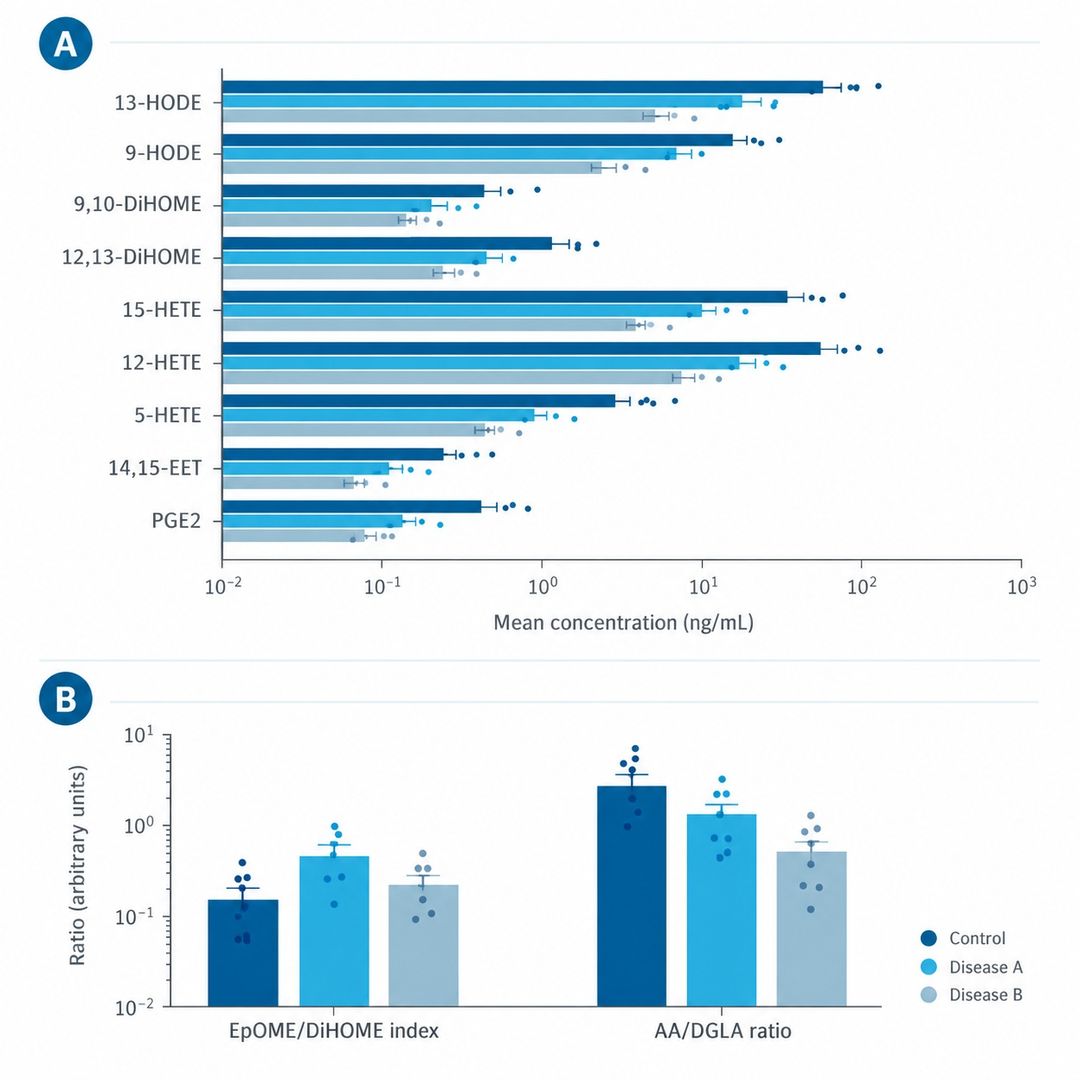
Representative targeted LC-MS/MS oxylipin panel with LA-branch and AA-branch
metabolites, shown with group-wise ratio comparison.
Ratio, Sum, and Pathway Report
Sums and ratios are reported as defined metrics with their composition stated, so that a value
can be compared with previously published data and with earlier batches from the same study.
Key Features:
- Total n-6, n-6/n-3, AA/DGLA, LA/AA, and adrenic/AA values with contributing species listed
- EpOME/DiHOME and EET/DiHETrE values reported as indices of soluble epoxide hydrolase
activity
- LA-branch versus AA-branch oxylipin balance, with consistent denominators across all samples
in a batch and any change in basis flagged explicitly
Group Comparison and Interpretation Support
Optional statistical and visual analysis is planned before data acquisition, so that group
structure, replicate type, missing-value handling, and normalization are not decided after the
results are visible.
Key Features:
- Univariate group comparisons with fold change and adjusted significance where the design
supports it
- Profile plots, heat maps, and precursor-to-metabolite relationship plots
- Pathway mapping of measured n-6 metabolites through desaturation, elongation, and oxidation
routes
- Editable tables in CSV or XLSX and report-ready figures in PNG or SVG format, with a PDF
summary on request
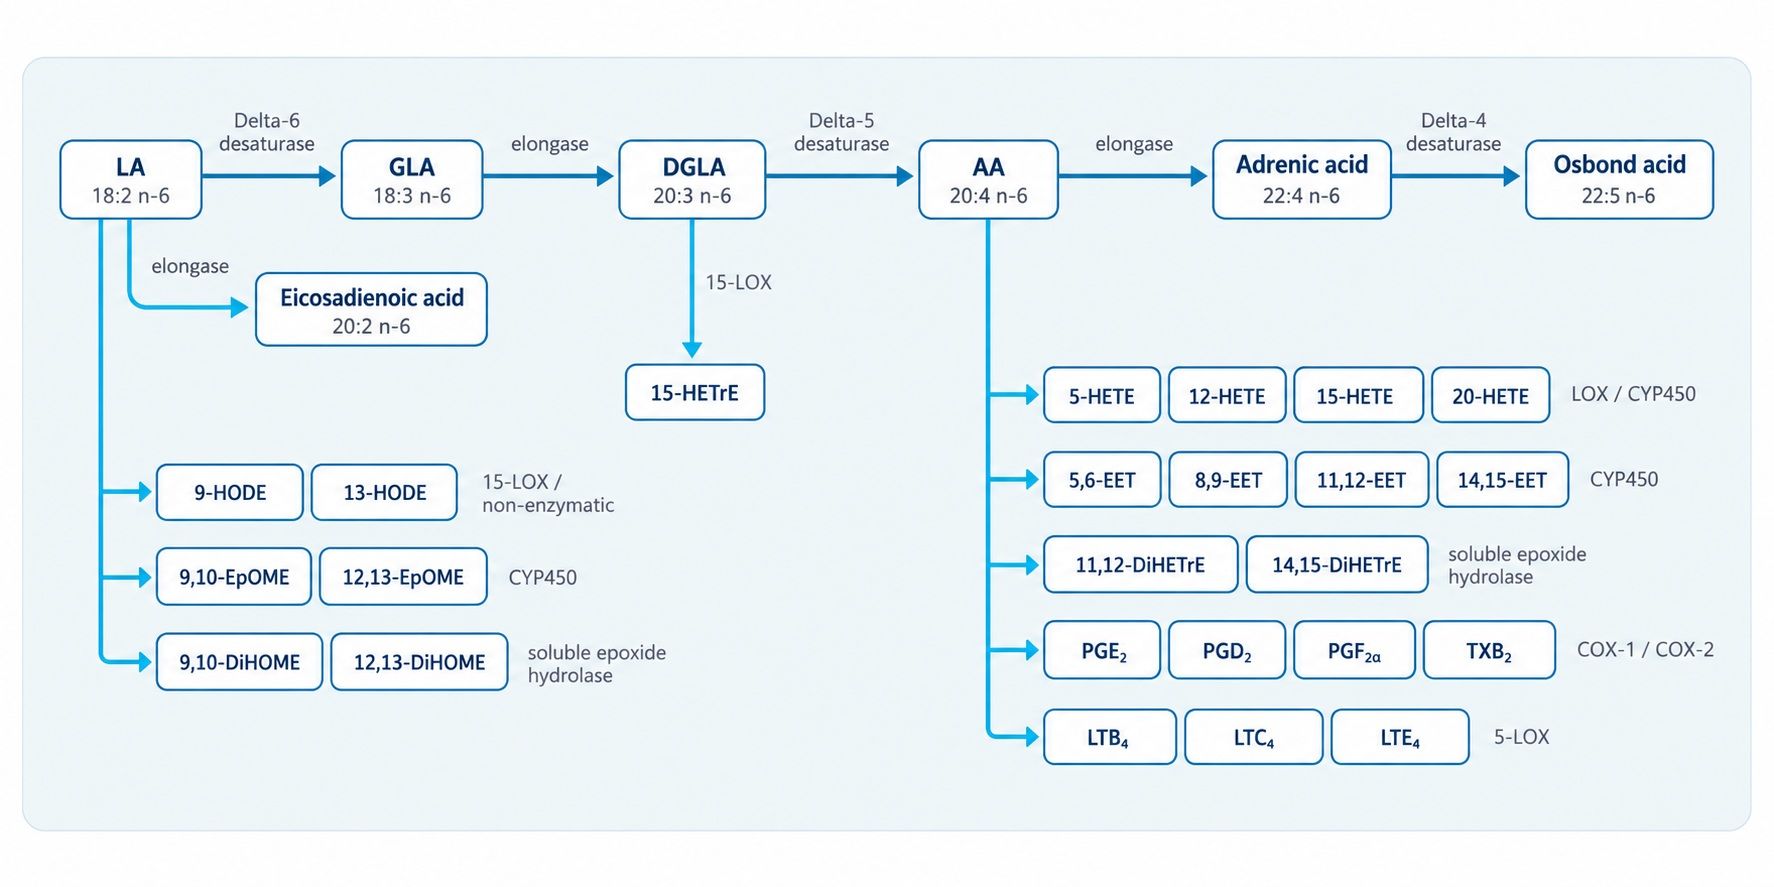 Omega-6 Desaturation, Elongation, and Oxidation Pathways: LA to GLA to DGLA to AA to adrenic acid by desaturation and elongation, with LA- and AA-derived oxidation branches through 15-LOX, CYP450, soluble epoxide hydrolase, cyclooxygenase, and 5-lipoxygenase.
Projects that extend into the wider oxidized lipid mediator landscape can be coordinated with oxylipin quantification
and pathway profiling, which places the n-6 metabolites alongside their n-3 counterparts within one
data structure.
What Omega-6 Fatty Acid Analysis Is Used For
The same panel supports projects that differ widely in matrix, endpoint, and required reporting basis.
Designs that do not match the patterns below are adapted during feasibility review.
Inflammation and Lipid Mediator Research
Measure the LA and AA branches together with their precursor pool, so that a study can
distinguish a change in substrate availability from a change in enzyme activity. DiHOME
and HETE panels resolve the soluble epoxide hydrolase and lipoxygenase routes
separately.
Cardiometabolic and Nutritional Studies
Use circulating and tissue n-6 species as biomarkers of dietary fat intake and as
exposure variables in cohort and intervention designs. Reporting as percentage of total
fatty acids allows comparison with published pooled analyses of LA and AA.
Dairy, Ruminant, and Supplement Characterization
Resolve c9,t11- from t10,c12-CLA and profile the wider C18:2 isomer distribution in milk
fat, meat, and formulated supplements, where isomer identity rather than total CLA
content determines the research question.
Food, Feed, and Oil Characterization
Verify n-6 composition and the LA-to-AA relationship in oils, feeds, and fortified
products, and track process-driven or lot-to-lot changes in the measured profile across
production batches.
Sample Requirements for Omega-6 Fatty Acid
Analysis
| Sample Type |
Collection and Handling |
Typical Starting Amount |
Planning Notes |
| Plasma or serum |
Collect with a documented anticoagulant protocol; separate promptly, aliquot, and store
below minus 70 degrees Celsius |
100 microliters (unesterified pool); 200 microliters or more for total fatty acids plus
oxylipins |
Use one anticoagulant and one processing delay across all samples; record fasting state and
storage duration |
| Whole blood or erythrocytes |
Wash and prepare erythrocytes consistently; snap-freeze the pellet and ship on dry ice |
100 microliters of packed cells |
Erythrocyte n-6 composition reflects longer-term intake than plasma; state the fraction
measured |
| Tissue |
Snap-freeze in liquid nitrogen immediately after dissection; store below minus 70 degrees
Celsius |
20 to 50 milligrams fresh weight |
Record wet weight, protein content, or another normalization variable, and keep it
consistent across groups |
| Cultured cells or cell pellets |
Wash with cold buffer, remove supernatant completely, and flash-freeze |
5 million cells or more |
Record cell count, protein content, and passage number; medium carryover changes the free
fatty acid fraction |
| Oils and lipid ingredients |
Store sealed in amber glass, protected from light, heat, and headspace oxygen |
100 microliters or more |
Provide the declared composition, antioxidant content, and expected concentration range
where known |
| Dairy and ruminant products |
Collect a representative portion; keep chilled or frozen and protect from light |
1 gram or more |
Fat content varies strongly within and between products, so homogenization and reporting
basis must be defined in advance |
| Foods, feeds, and formulated products |
Provide a homogenized representative sample; state whether the sample is a dry powder,
emulsion, or capsule fill |
0.2 to 1 gram |
State the intended reporting basis, such as per mass of sample, per gram of fat, or per gram
of total fatty acids |
Amounts above are planning figures. Final quantities are confirmed once the target panel and analytical route
are selected, because a low-abundance oxylipin panel, a broad fatty acid profile, and a repeat analysis do
not have the same requirement. The FAQ below lists the information needed to begin a feasibility review.
Frequently Asked Questions About Omega-6 Fatty Acid
Analysis
Should I request free or total omega-6 fatty acids?
The two pools answer different questions. Free fatty acids are the unesterified fraction
present at collection. A total-fatty-acid workflow hydrolyzes the esterified fraction
and therefore also captures fatty acids released from phospholipids, triglycerides, and
cholesteryl esters. Published validated plasma assays measure free and total omega-3 and
omega-6 fatty acids separately, but report the two in their own units; they are not
interchangeable.
- Choose the free pool when the question concerns circulating unesterified substrate
or acute lipolytic release
- Choose total fatty acids when the question concerns membrane composition, habitual
intake, or tissue stores
- Choose a defined fraction, such as plasma phospholipids, when the study protocol
specifies it in advance
Can linoleic acid and arachidonic acid be quantified in the same run?
In most matrices, yes. LA and AA differ substantially in abundance, and in plasma the gap
can exceed an order of magnitude, so the calibration range is set to cover both ends
rather than centered on the mid-range. Where an individual species falls outside the
calibrated range, the dilution or concentration step is documented and the result is
flagged so that it is not read as a direct measurement.
How do you control linoleic acid oxidation during sample preparation?
LA predominates among polyunsaturated fatty acids in most matrices and is susceptible to
ex vivo autoxidation, so HODE, EpOME, and DiHOME can form after collection rather than
in the biological system. Extraction runs under nitrogen with antioxidant stabilization,
samples are processed cold, and extracts are stored in amber vials below minus 70
degrees Celsius. Freeze-thaw cycles are avoided because they change measured oxylipin
profiles.
Can c9,t11-CLA be separated from t10,c12-CLA?
Yes. CLA isomers share the same nominal mass and cannot be distinguished by MS alone, so
separation is achieved chromatographically on a polar capillary column. The second
requirement is chemical: raising fatty acids to 95 degrees Celsius during methylation
promotes cis-to-trans isomerization and can generate conjugated isomers absent from the
sample, so derivatization runs at room temperature. Reported precision for plasma fatty
acid methyl esters is better than 10 percent coefficient of variation with this
approach.
How is the n-6/n-3 ratio defined?
The ratio depends entirely on which species are summed and on the reporting basis, so it
is meaningless without both. Reports list the species contributing to the numerator and
denominator, the units, and whether the value is calculated on percentage composition,
molar amount, or absolute concentration. Ratios calculated on different bases are not
comparable to each other.
In pooled cohort analyses of omega-6 biomarkers, LA and AA are conventionally expressed
as a percentage of total fatty acids, which is the basis used when results are intended
for comparison with that literature.
Is this service for clinical diagnostic use?
No. This service is for research use only. It is not intended for clinical diagnostic
procedures, patient management, or treatment decisions, and no result is reported as a
clinical index. Clinical fatty acid profile testing and omega-3 or omega-6 index assays
are performed by licensed clinical laboratories. If your study involves samples that may
require clinical follow-up, indicate this during study design.
What information is needed for a quote?
Provide the matrix, species or product type, number of groups and replicates, total
sample count, priority analytes, expected concentration range where known, free or total
measurement preference, requested reporting units, available sample amount, and storage
history. Mention any diet, treatment, processing step, or formulation component that
could affect interpretation, along with the comparisons the data must support.