What are Heptadecanoids?
Heptadecanoids are a specific subclass of bioactive lipids, derived from heptadecanoic acid (C17:0), a saturated fatty acid with a 17-carbon backbone. This lipid category is gaining considerable attention in biological research due to its involvement in several metabolic pathways and potential implications in health and disease. Unlike more commonly studied fatty acids, heptadecanoic acid and its derivatives, collectively known as heptadecanoids, offer unique biological properties, particularly in signaling, inflammation regulation, and energy metabolism.
Heptadecanoic acid can be found naturally in various sources, including butterfat, certain fish oils, and ruminant animal products. Although it occurs in relatively low concentrations, recent studies suggest that heptadecanoids could play a significant role in cardiovascular health, insulin sensitivity, and the immune response. Because of their unique properties, the study and quantification of heptadecanoids have become critical in advancing our understanding of lipid metabolism and its broader physiological implications.
Creative Proteomics offers a comprehensive heptadecanoids analysis service that specializes in the detailed profiling and quantification of heptadecanoic acid and its derivatives.
Heptadecanoids Analysis Service by Creative Proteomics
Lipid Profiling: We analyze the full spectrum of heptadecanoids in biological samples (plasma, serum, tissues, food), identifying various forms of heptadecanoic acid and related metabolites for a comprehensive lipid profile.
Quantification of Heptadecanoids: Utilizing LC-MS/MS and GC-MS techniques, we precisely quantify heptadecanoids, even at trace levels, to elucidate their roles in metabolic processes and inflammation.
Biomarker Identification: Our service identifies potential heptadecanoid biomarkers associated with diseases or metabolic disorders, facilitating therapeutic and diagnostic exploration.
Comparative Studies: We conduct comparative analyses of heptadecanoid levels across different conditions (dietary changes, drug treatments, disease states) to reveal their physiological and pathological significance.
Data Interpretation: Creative Proteomics provides expert interpretation of lipidomics data, offering insights into the impact of heptadecanoids on cardiovascular health, metabolic regulation, and immune responses.
List of Heptadecanoids We Can Detect
| Heptadecanoic Acid (C17:0) | Heptadecanoic Acid Methyl Ester | Heptadecadienoic Acid (C17:2) | Heptadecatrienoic Acid (C17:3) |
| Heptadecanol | Heptadecanoyl-CoA | Heptadecanoyl-Phosphatidylcholine |
|
Analytical Techniques for Heptadecanoids Analysis
Liquid Chromatography-Mass Spectrometry (LC-MS/MS)
LC-MS/MS is one of the most powerful tools for heptadecanoid analysis. This technique allows for the separation, detection, and quantification of lipid species with high sensitivity and specificity. Creative Proteomics uses advanced LC-MS/MS platforms for both targeted and untargeted lipidomics, ensuring that even low-abundance heptadecanoids can be accurately measured. This method is ideal for identifying novel heptadecanoids and tracking changes in lipid profiles across different experimental conditions.
Gas Chromatography-Mass Spectrometry (GC-MS)
For the analysis of saturated fatty acids like heptadecanoic acid, GC-MS remains a gold-standard technique. Creative Proteomics applies GC-MS for the quantification of heptadecanoic acid in biological samples, offering unparalleled precision and reproducibility. The technique is particularly suited for studies focused on fatty acid composition in food, tissue, and serum samples.
High-Performance Liquid Chromatography (HPLC)
HPLC is another critical tool used in the separation and quantification of heptadecanoids. HPLC is often paired with UV or fluorescence detection for specific applications where mass spectrometry may not be required. Creative Proteomics offers HPLC-based methods for routine quantification and characterization of heptadecanoids, especially in quality control and comparative studies.

Sample Requirements for Heptadecanoids Analysis
| Sample Type | Required Amount | Storage Conditions | Notes |
|---|
| Plasma/Serum | 100-200 µL | -80°C | Collect in EDTA or heparin tubes; avoid hemolysis. |
| Tissue (Liver, Muscle) | 50-100 mg | -80°C | Snap freeze in liquid nitrogen immediately after collection. |
| Cell Pellets | 1-2 x 10⁶ cells | -80°C | Wash cells with PBS before freezing; snap freeze immediately. |
| Food Samples | 500 mg | -20°C or lower | Homogenize samples before freezing for uniform extraction. |
| Urine | 500 µL | -80°C | Store in aliquots to avoid freeze-thaw cycles; ensure sterile collection. |
If you have any questions about our lipidomics services, please contact us.
Case Chronic Atrophic Gastritis: Metabolite and Microbiota Interplay as Non-Invasive Biomarkers
Background
Chronic Atrophic Gastritis (CAG) is an inflammatory condition that leads to the loss of gastric mucosal glands, significantly elevating the risk of gastric cancer (GC). Traditional diagnostic methods, primarily gastroscopy with tissue biopsy, are invasive and carry several drawbacks, creating a need for non-invasive alternatives.
Recent research highlights the role of metabolites as potential biomarkers for the progression from chronic superficial gastritis (CSG) to gastric cancer. Metabolites like azelaic acid and glutamate may indicate GC risk, and interventions from traditional Chinese medicine have shown promise in modulating these metabolites in CAG models.
Additionally, the gut microbiota interacts with the gastrointestinal tract, producing functional metabolites that influence host metabolism and inflammation. Dysbiosis in gut microbiota has been linked to the development of CAG, suggesting a relationship between microbial composition and disease progression.
Despite the known crosstalk between gut microbiota and metabolites, there is limited research on this interaction in CAG patients. This study aims to clarify the gut microbiota and metabolite profiles in the feces of CAG patients, exploring their potential as non-invasive biomarkers for diagnosis.
Materials & Methods
Samples
The study included a total of 66 healthy volunteers and 110 patients diagnosed with chronic atrophic gastritis (CAG) who underwent endoscopic examinations at Shanghai University of TCM-affiliated hospitals. The participants were categorized into different sample sets:
- Sample Set A: Fecal metabolites were analyzed from 78 participants (30 healthy controls and 48 CAG patients) using ultraperformance liquid chromatography/tandem mass spectrometry (UPLC-MS/MS).
- Sample Set B: Gut microbiota profiles were examined in 65 participants (20 healthy controls and 45 CAG patients) through 16S rRNA sequencing.
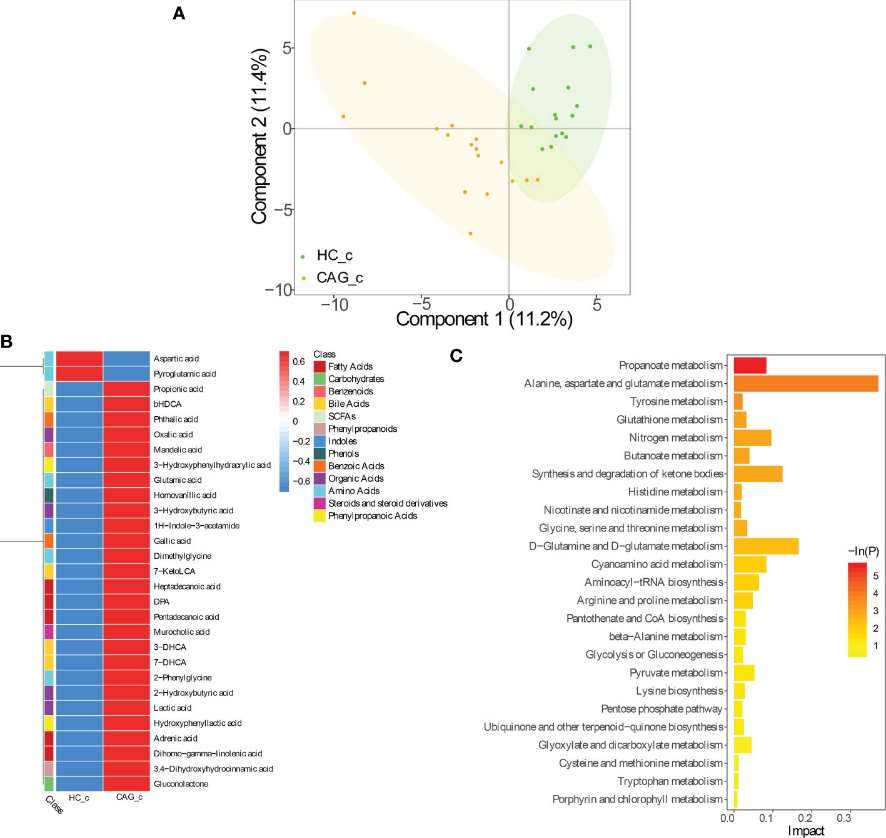
- Sample Set C: Both gut microbiota and metabolite profiles were investigated in 33 participants (16 healthy controls and 17 CAG patients) for verification purposes.
Participants met specific inclusion criteria for CAG diagnosis based on pathological examinations, while those with gastric polyps, tumors, or other gastrointestinal issues were excluded. All clinical information was collected via questionnaires, and informed consent was obtained from all participants. Fecal samples were promptly frozen at -80°C after collection for analysis.
Technical Methods
Targeted Fecal Metabolomics Profiling
- Metabolite Detection: Fecal metabolites were analyzed using UPLC-MS/MS with Q300 assay kits. Samples were lyophilized, homogenized with ultrapure water, and extracted with methanol containing internal standards. Following homogenization and centrifugation, the supernatant underwent derivatization and was subsequently prepared for analysis.
- Mass Spectrometry Conditions: Capillary voltage was set at 1.5 kV for ESI+ and 2.0 kV for ESI-. The source and desolvation temperatures were maintained at 150°C and 550°C, respectively. The raw data were processed using MassLynx software, with absolute concentrations calculated for 146 metabolites. Data analysis involved univariate and multivariate statistical methods using the iMAP platform.
DNA Extraction and 16S rRNA Sequencing
- DNA Extraction: Genomic DNA was extracted from fecal samples using the QIAamp DNA Stool Mini Kit. DNA quality was confirmed through agarose gel electrophoresis.
- PCR Amplification: The 16S rRNA gene was amplified using specific primers for the V4-V5 regions. Two-step amplicon library construction included dual barcoding for multiplexing.
- Sequencing: Libraries were sequenced on the MiSeq platform, and the raw reads were deposited in the NCBI Sequence Read Archive. Data processing included demultiplexing, quality trimming, and merging of reads, followed by operational taxonomic unit (OTU) clustering and taxonomic assignment using established databases.
Data Analysis
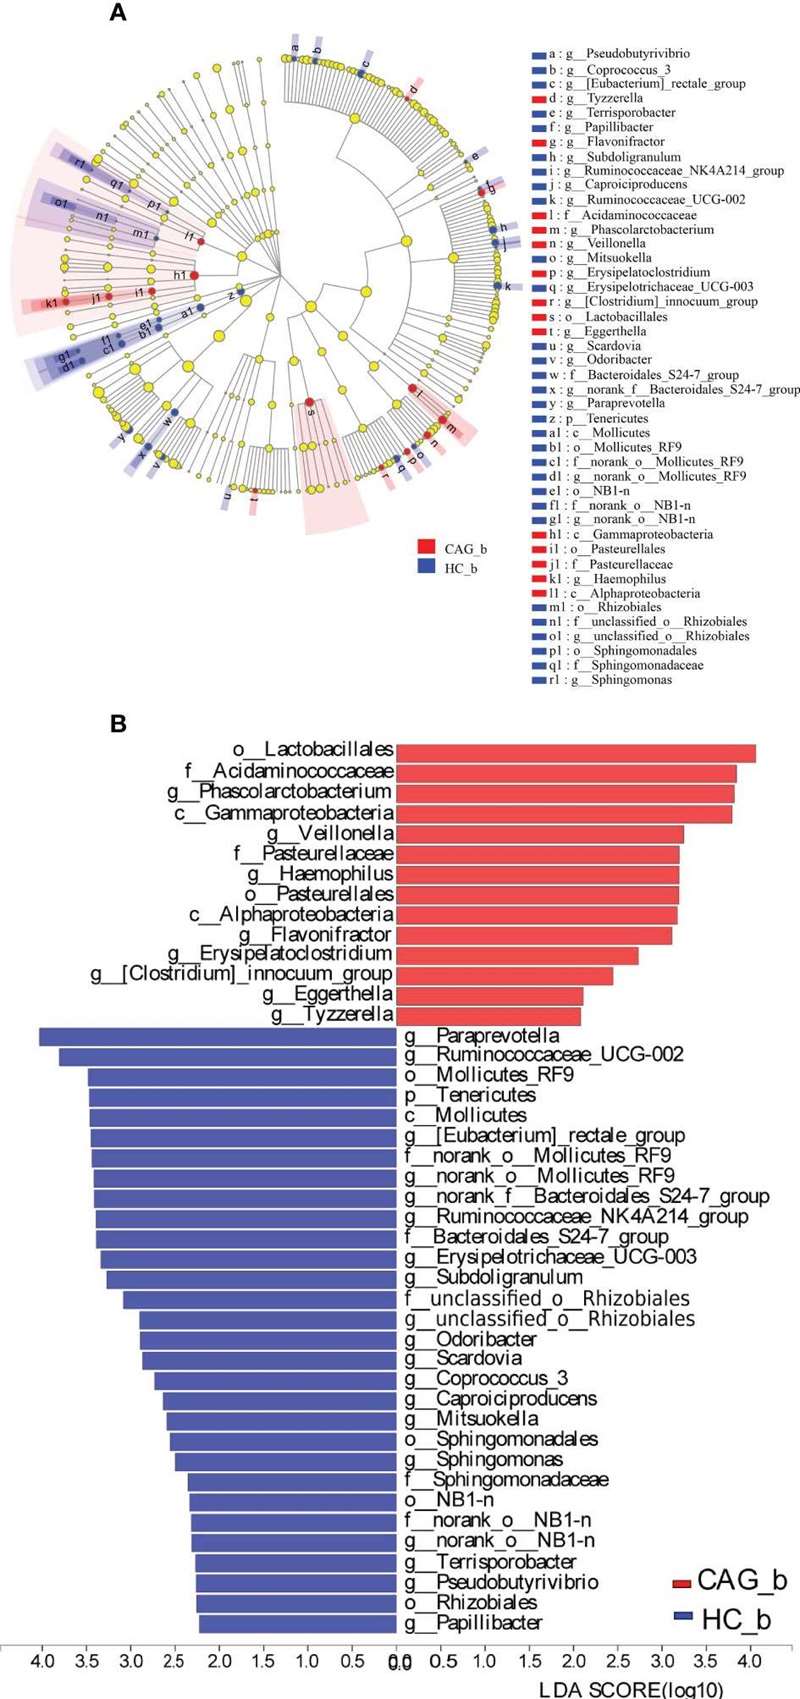
- Diversity Analysis: Alpha diversity was assessed using Shannon and Sobs indices. The LDA effect size (LEfSe) method analyzed significant differences in bacterial genera.
- Correlation Analysis: Spearman's rank correlation assessed relationships between fecal metabolites and gut microbes. Functional predictions were made using PICRUSt based on OTU abundance.
Feature Selection and Statistical Analysis
- Random Forest and SVM: Feature selection involved random forest to determine the importance of 35 metabolites and 27 gut microbes. An SVM model was trained and evaluated using ROC curves, with a threshold AUC >0.7 indicating predictive value.
- Statistical Tests: Differences between groups were analyzed using Student's t-test or Mann-Whitney U-test via SPSS software. Statistical significance was defined as P<0.05.
This comprehensive methodology aims to elucidate the interplay between gut microbiota and metabolites in patients with CAG, potentially identifying non-invasive biomarkers for diagnosis.
Results
Serum Lipid Profiles in CAG Patients
Increased Levels: Serum levels of bile acid, total cholesterol, and low-density lipoprotein (LDL) were significantly higher in patients with Chronic Atrophic Gastritis (CAG) compared to healthy controls (HC), with a p-value of < 0.05.
No Significant Difference: No significant differences were observed in high-density lipoprotein (HDL) cholesterol, triglycerides, or total bilirubin levels between the two groups.
Fecal Metabolite Profiles
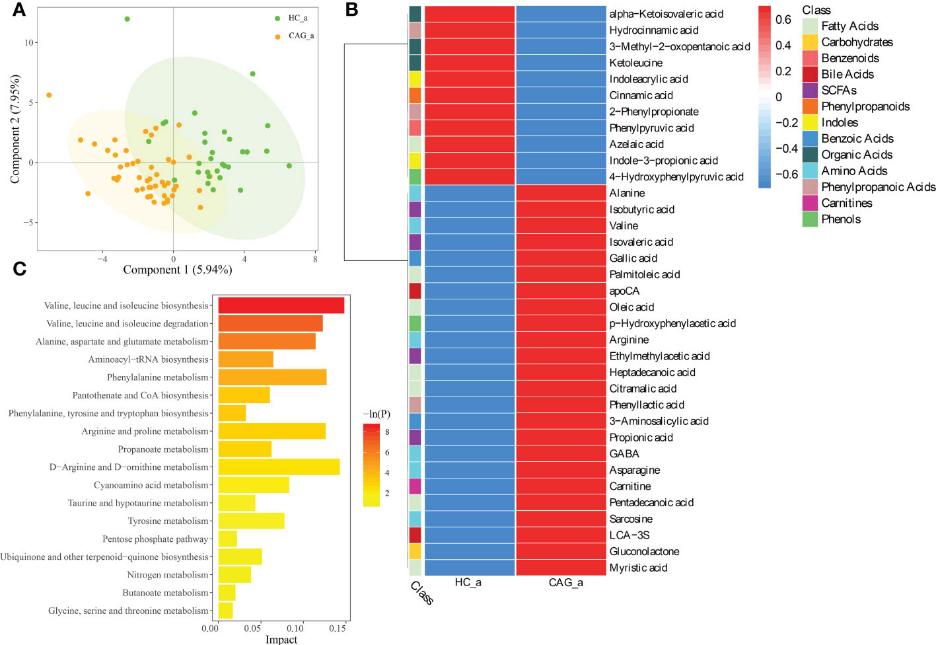
Diverse Metabolite Categories: A total of 146 metabolites across 16 categories were identified in fecal samples from CAG patients and healthy volunteers. Key categories included amino acids, bile acids, fatty acids, and short-chain fatty acids (SCFAs).
PLS-DA Analysis: PLS-DA revealed a distinct separation between the metabolite profiles of CAG patients and healthy controls, indicating significant differences in fecal metabolites.
Differential Metabolites: In the CAG group, 35 fecal metabolites showed significant differences compared to healthy controls:
- Upregulated: 24 metabolites (e.g., alanine, isobutyric acid, and oleic acid).
- Downregulated: 11 metabolites (e.g., cinnamic acid, indoleacrylic acid).
Metabolic Pathway Enrichment
Key Pathways: KEGG analysis highlighted several metabolic pathways associated with the altered metabolites, including:
- Valine, leucine, and isoleucine metabolism
- Aminoacyl-tRNA biosynthesis
- Phenylalanine metabolism
- Propanoate metabolism
Fecal Gut Microbiota Profiles
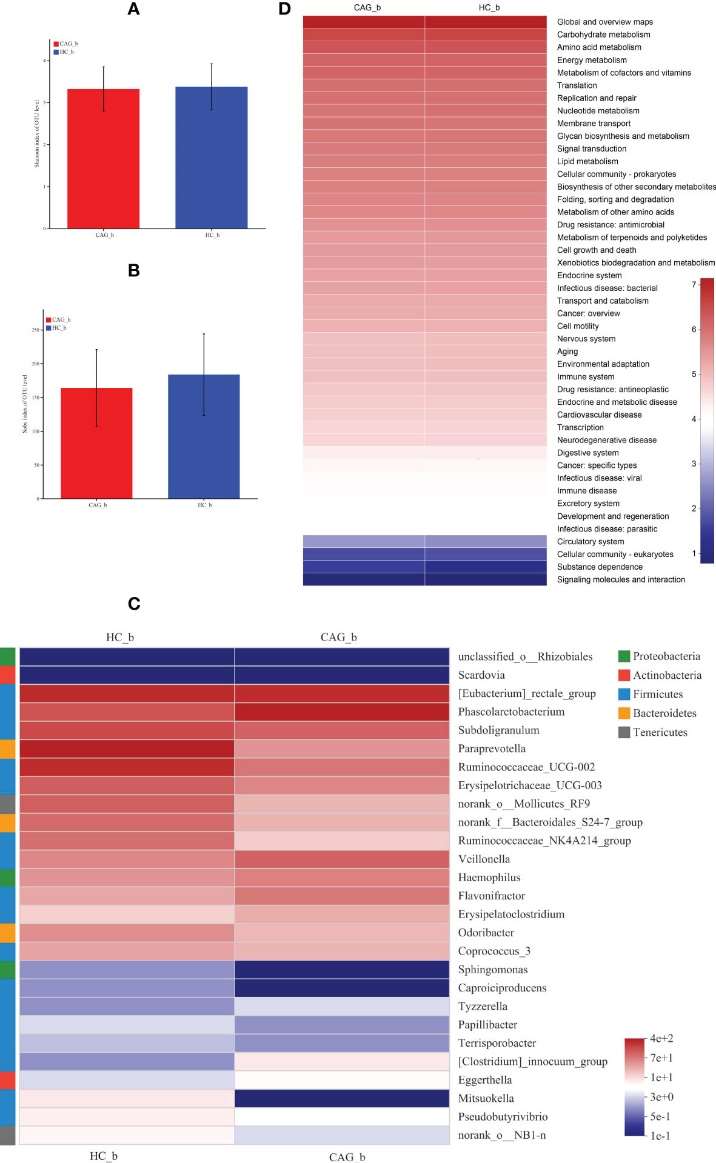
Alpha-Diversity: No significant differences in the Sobs index and Shannon index, indicating similar diversity levels in gut microbiota between CAG patients and healthy controls.
LEfSe Analysis: Significant differences were found in the bacterial composition:
- Significant Genera: 27 genera were identified with differences, including Eggerthella, Phascolarctobacterium, and Veillonella in CAG patients.
- Decreased Genera: Genera such as Papillibacter and Pseudobutyrivibrio were significantly reduced in CAG patients.
Functional Analysis of Gut Microbiota
PICRUSt Analysis: The functional potential of gut microbiota in CAG patients indicated involvement in carbohydrate and amino acid metabolism, energy metabolism, and various biosynthetic processes.
Feature Selection and Classification Models
Fecal Metabolites: Using Random Forest (RF), a set of 7 fecal metabolites was identified as biomarkers, achieving an accuracy of 93.8% in distinguishing CAG patients from healthy controls.
Gut Microbes: A separate analysis identified 4 gut microbes, achieving an accuracy of 92.3%.
Combined Model: A classification model incorporating both metabolites and gut microbes achieved robust classification performance, underscoring the potential for these biomarkers in diagnosing CAG.
 Alteration of fecal-derived metabolites profiles in CAG_a patients.
 Alteration of fecal-derived metabolites profiles in CAG_c patients.
 Alteration of fecal-derived gut microbiota profiles in CAG_b patients.
 Enriched gut microbiota profiles in feces of CAG_b patients and/or HC_b healthy volunteers.
Reference
- Gai, Xiao, et al. "Heptadecanoic acid and pentadecanoic acid crosstalk with fecal-derived gut microbiota are potential non-invasive biomarkers for chronic atrophic gastritis." Frontiers in Cellular and Infection Microbiology 12 (2023): 1064737.


 Alteration of fecal-derived metabolites profiles in CAG_a patients.
 Alteration of fecal-derived metabolites profiles in CAG_c patients.
 Alteration of fecal-derived gut microbiota profiles in CAG_b patients.
 Enriched gut microbiota profiles in feces of CAG_b patients and/or HC_b healthy volunteers.