What is arachidonic acid?
Arachidonic acid (ARA, AA) is a full cis-5,8.11,14-eicosatetraenoic acid, which is a long-chain polyunsaturated fatty acid of the Omega-6 group. It is a kind of polyunsaturated essential fatty acid with high content and the widest distribution in living organisms. The majority of free arachidonic acid is bound to the second carbon of glycerol in the phospholipids of cell membranes and is released by enzymatic hydrolysis when needed.
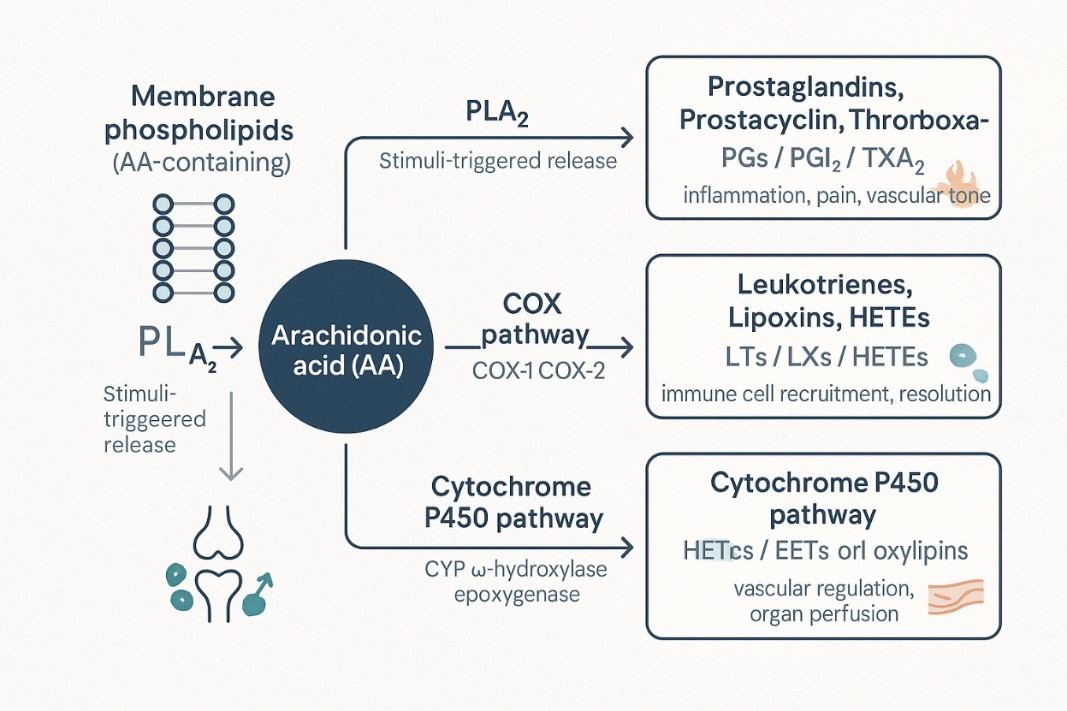
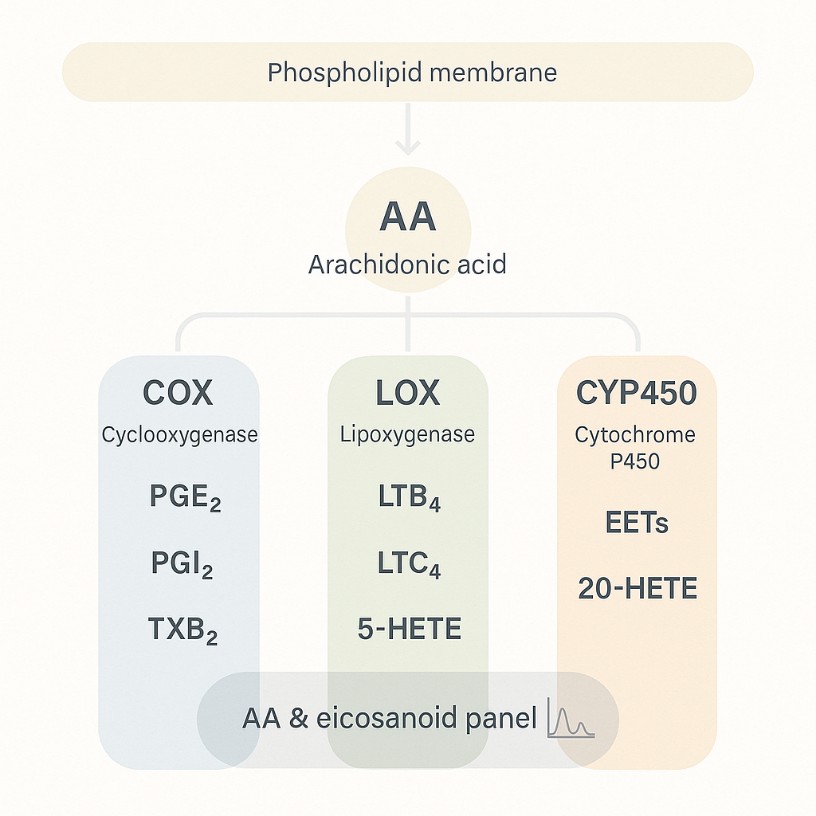
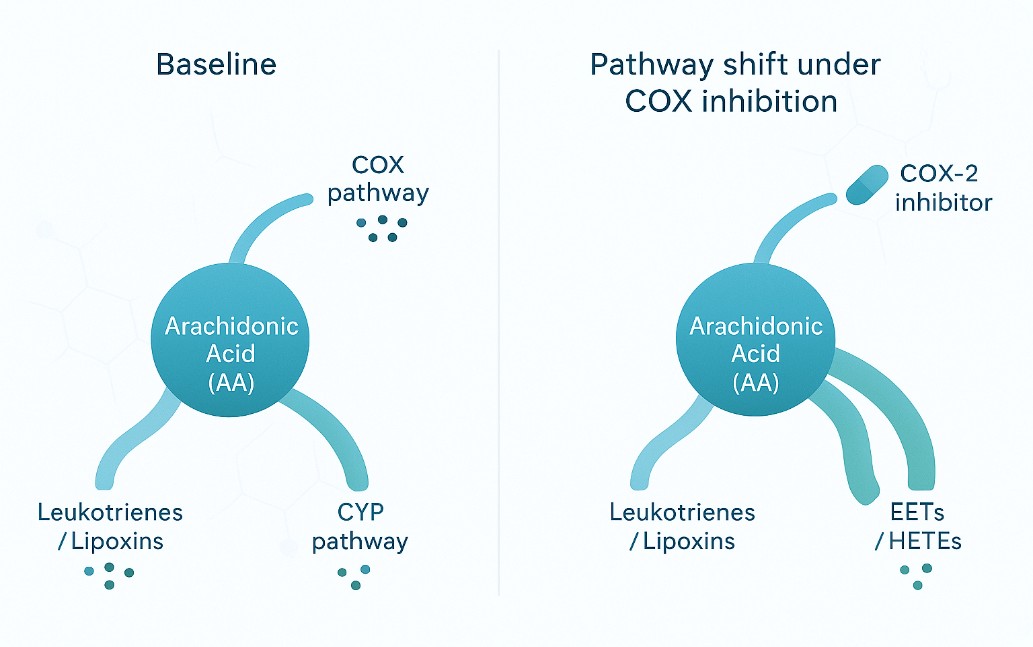
Arachidonic acid can be transformed into various metabolites in the body, most of which have strong physiological effects, and a wide range of effects, is an important substance for cell regulation. Arachidonic acid has three main metabolic pathways in living organisms: through cyclooxygenase (COX), lipoxygenase (LOX) or cytochrome P-450 (CYP-450) to produce prostaglandin (PG), thromboxane (TX), leukotiene (LT) or hydroxyfraty acid (OHFA). COXs are divided into 3 forms: COX-1 (constitutive), COX-2 (mitogen-induced form) and COX-3 (variant of COX-1).
Arachidonic acid is released from membrane phospholipids via phospholipase A2s and plays an important biological role in vivo. It is widely involved in immune and inflammatory responses and is a biomarker of inflammation. Accurate qualitative and quantitative analysis of arachidonic acid is of great value in studying the development mechanism, diagnosis and prediction of related diseases.
Creative Proteomics has established an LC-MS assay for arachidonic acid and its metabolites, which allows simultaneous detection of multiple compounds. We are equipped with Thermo Q Exactive and ABsciex Qtrap5500 instruments to enable highly accurate qualitative and quantitative assay services for arachidonic acid and its metabolites.
List of detectable arachidonic acid at Creative Proteomics
| Prostaglandins (PGs) | Prostaglandin H2, Prostaglandin A1, Prostaglandin A2, Prostaglandin D2, Prostaglandin E2, 6-keto-Prostaglandin F1a, Prostaglandin F2a, Prostaglandin I2 |
| Thromboxanes (TBs) | Thromboxane B2 |
| Leukotrienes (LTs) | Leukotriene C4, Leukotriene B4, Leukotriene B5, Leukotriene D4, Leukotriene E4, 6-Trans-leukotriene B4, 11-Trans-leukotriene C4, 12-Trans-leukotriene D4, 13-Trans-leukotriene E4 |
| Hydroxy, dihydroxy arachidonic acids (HETEs) | 5-HETE, 8-HETE, 12-HETE, 15-HETE, 19(R)-HETE, 20-HETE, 5(6)-DiHET, 8(9)-DiHET, (±)11(12)-DiHET, (±)14(15)-DiHET |
| Oxyeicosatrienoic acids (EETs) | 5-oxo-ETE, 5,6-EET, 8,9-EET, 11,12-EET, 14,15-EET |
| Oxyoctadecadienoic acid | 13-OXoODE |
| Hydroxy-octadecadienoic acid | 9-HODE |
| Oxo-octadecadeca-enoic acid | 9,10-EPOME, 12,13-EPOME |
| Dihydroxyoctadecenoic acid | 9,10-DiHoME, 12,13-DiHOME |
Technology platform for arachidonic acid analysis
Arachidonic acid (AA) analysis is conducted through advanced mass spectrometry techniques, ensuring exceptional sensitivity and specificity for precise results. Our primary approach involves the use of liquid chromatography-mass spectrometry (LC-MS), employing cutting-edge instruments like the Agilent 6495 Triple Quadrupole LC/MS System. This method, utilizing liquid chromatography for component separation, enables the accurate quantification and identification of AA based on its mass-to-charge ratio.
For the analysis of volatile compounds such as arachidonic acid methyl esters, gas chromatography-mass spectrometry (GC-MS) is applied, utilizing sophisticated instrumentation like the Thermo Fisher Trace 1310 Gas Chromatograph coupled with ISQ Single Quadrupole Mass Spectrometer. GC-MS, with its gas chromatography separation and precise mass measurements, ensures accurate identification.
Our service also leverages high-resolution mass spectrometry (HR-MS), employing state-of-the-art instruments like the Bruker Impact II QTOF Mass Spectrometer. This technology facilitates accurate mass determination, enhancing the identification and characterization of arachidonic acid and its derivatives.
Targeted analysis, crucial for precise quantification, is accomplished through triple quadrupole mass spectrometry (QqQ MS), exemplified by the SCIEX Triple Quad 6500 LC/MS System. The use of multiple reaction monitoring (MRM) enhances selectivity for arachidonic acid quantification.
In-depth structural elucidation of arachidonic acid and its derivatives is achieved through ion trap mass spectrometry, represented by the Thermo Fisher LTQ XL Linear Ion Trap Mass Spectrometer, which enables MSn analyses.
Our tailored approach ensures that the choice of technique and instrument aligns seamlessly with the unique requirements of your analysis, providing unparalleled insights into the world of arachidonic acid and its derivatives.
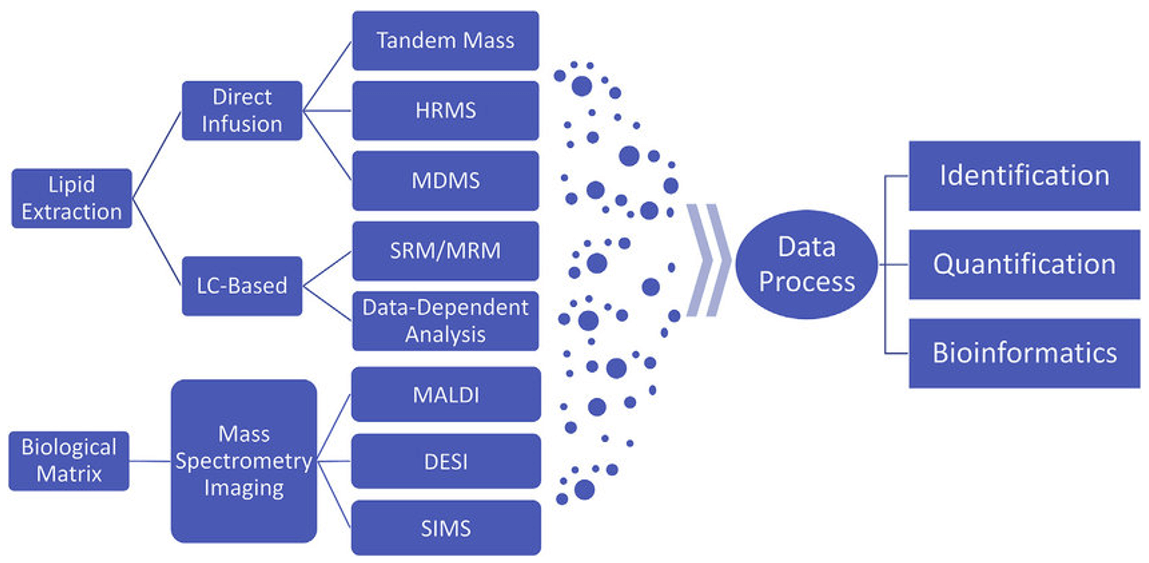 A typical workflow of mass spectrometry-based lipidomics (Wang et al., 2019)
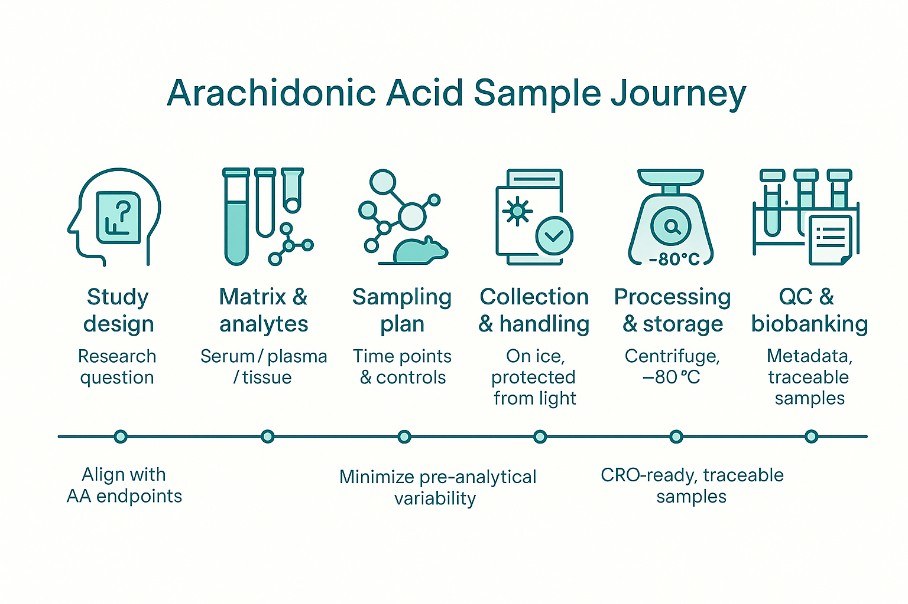
Sample requirements for arachidonic acid analysis
- Serum/Plasma: ≥ 500 ul/sample
- Animal tissue: ≥ 200 mg/sample
- Urine: ≥ 1 ml/sample
- Plant tissue: ≥ 200 mg/sample
- Microorganism ≥ 200 mg/sample
If you want to analyze other samples, please contact our experts for consultation.
Deliverables of arachidonic acid analysis
| Deliverable | Description |
|---|
| Identification Report | Detailed information on identified arachidonic acid species. |
| Classification based on lipid categories (e.g., phospholipids, glycerolipids). |
| Precise mass and retention time of each identified arachidonic acid. |
| Quantification Data | Quantitative data for each identified arachidonic acid species. |
| Relative abundance or concentration levels. |
| Pathway Analysis | Interpretation of arachidonic acid profiles in the context of cellular pathways. |
| Correlation between arachidonic acid changes and cellular functions. |
| Statistical Analysis | Statistical tests for assessing significance in arachidonic acid abundance. |
| Heatmaps or clustering analysis for visualizing trends. |
| Interactive Visualization | User-friendly graphs, charts, and plots for exploring data interactively. |
| Comprehensive Report | Detailed summary of key findings, interpretations, and recommendations. |
| Expert Consultation | Availability of experts for addressing questions or concerns. |
Reference:
- Wang, Jianing, Chunyan Wang, and Xianlin Han. "Tutorial on lipidomics." Analytica chimica acta 1061 (2019): 28-41.
Case: Distinct Lipid Mediator Profile in Progressive Multiple Sclerosis: Association with Neurodegenerative Processes and Disability
Background
This study investigates the lipid mediator profile, specifically focusing on the ω-6 pathway, in the context of multiple sclerosis (MS). The research aims to understand the association between bioactive lipid mediators and various aspects of MS pathology, with a particular emphasis on progressive MS.
Sample
The study includes 285 participants, comprising 170 patients with relapsing-remitting MS (RRMS), 115 patients with progressive MS (PMS), and 125 age-matched healthy controls. Serum samples were utilized for the analysis of lipid mediators.
Methods
PLS-DA Analysis: Principal Component Analysis-Discriminant Analysis (PLS-DA) was employed to assess and optimize the separation of subgroups (HCs, RRMS, and PMS) based on 14 lipid mediators from the ω-6 pathway.
Hierarchical Clustering: Two-way hierarchical clustering was performed to identify lipid mediator clusters based on their origin in the ω-3/ω-6 pathways and individual profiles.
Correlation Analysis: Linear regression and correlation analyses were conducted to assess associations between lipid mediators, disability (EDSS), neurodegenerative markers (sNfL and sGFAP), and MRI-derived volumetric measures.
Data Availability: Anonymized data, not published in the article, will be shared upon reasonable request from a qualified investigator.
Results
Distinct Profile in PMS: Patients with PMS exhibit a unique lipid mediator profile characterized by increased levels of arachidonic acid (AA) and its derivatives (5-HETE, 8-HETE, 15-HETE).
Association with Disability: Higher levels of 15-HETE are specifically associated with worse disability in PMS, as indicated by EDSS scores, suggesting a link between AA pathway components and neurodegeneration.
Correlation with Neurodegenerative Processes: 15-HETE levels correlate with higher sNfL concentrations, indicative of axonal damage, and lower brain volumes, suggesting a potential role in CNS-associated pathologic processes.
Altered ω-6 Pathway: Lower levels of linoleic acid (LA) derivatives (9-HODE and 13-HODE) in PMS indicate an altered lipid mediator profile in the ω-6 pathway, possibly influenced by changes in enzyme expression and activity.
Implications for MS Pathogenesis: The findings highlight the potential relevance of lipid mediators, particularly those from the ω-6 pathway, in understanding the pathogenesis of MS, especially in the context of neurodegenerative events and disability in progressive MS.
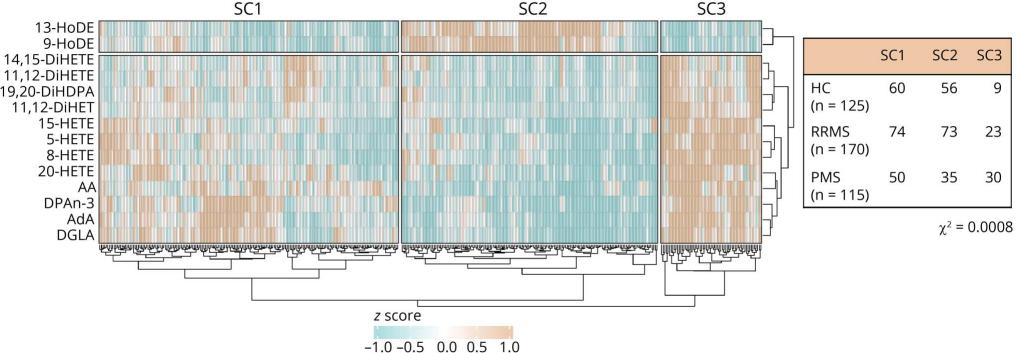 Heatmap with hierarchical cluster analysis (Euclidean distance) showing the distribution of Project Y cohort participants (x-axis) over the 3 sample clusters that are based on the ω-3/ω-6 lipid mediator plasma levels (y-axis)
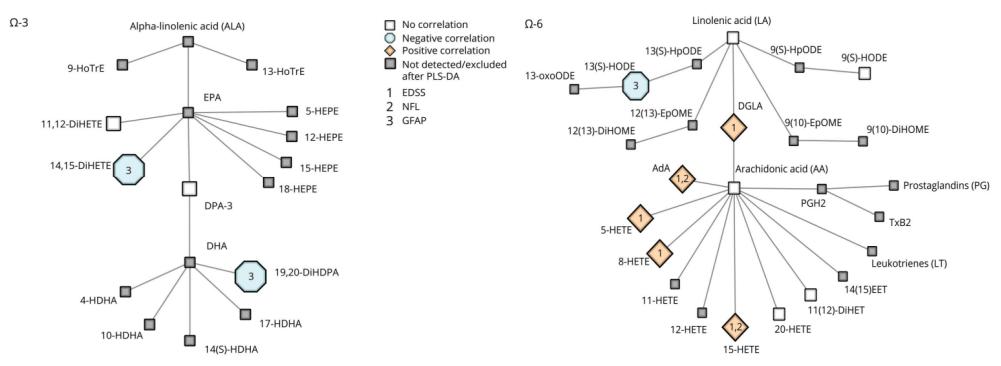 Schematic Overview of ω-3/ω-6 LM Pathways and Correlations With Clinical Parameters
Reference
- Jahangir, Muhammad, et al. "Metabolomic variation of Brassica rapa var. rapa (var. raapstelen) and Raphanus sativus L. at different developmental stages." Pakistan Journal of Botany 46.4 (2014): 1445-1452.


 A typical workflow of mass spectrometry-based lipidomics (Wang et al., 2019)
 Heatmap with hierarchical cluster analysis (Euclidean distance) showing the distribution of Project Y cohort participants (x-axis) over the 3 sample clusters that are based on the ω-3/ω-6 lipid mediator plasma levels (y-axis)
 Schematic Overview of ω-3/ω-6 LM Pathways and Correlations With Clinical Parameters