Stoichiometric Molar Ratio Determination
Accurate quantification of absolute concentration (mg/mL) and relative molar fraction (mol%) for all 4 lipid classes in a single chromatographic separation.

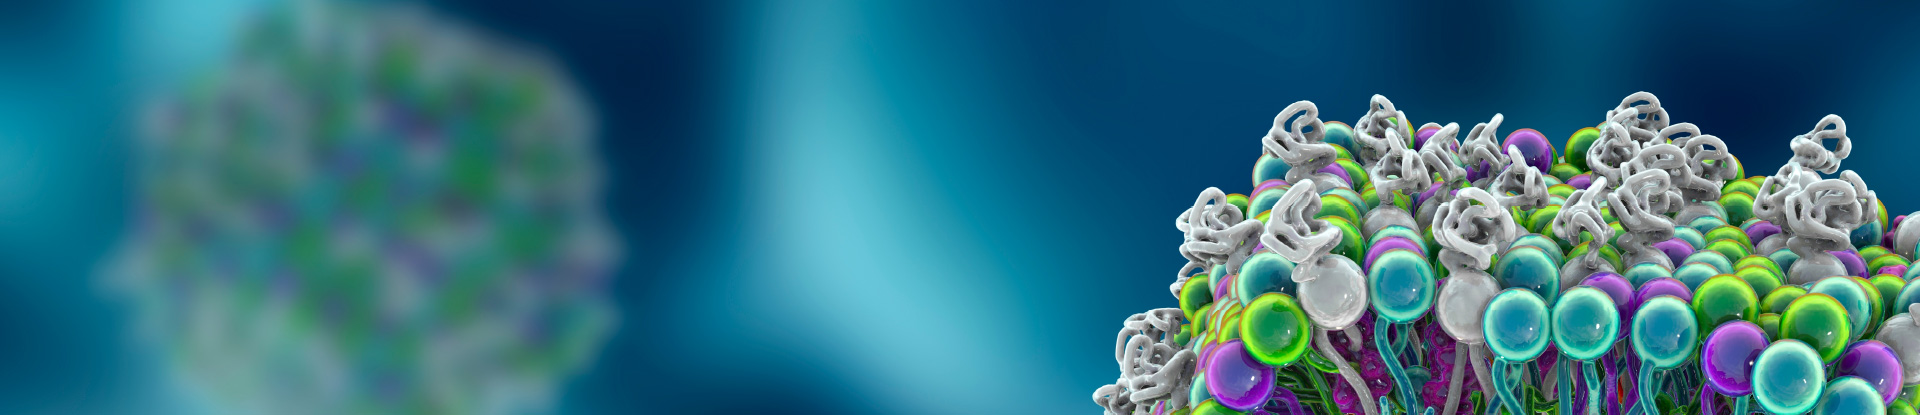
Quantifying the precise molar stoichiometry of all four lipid components in lipid nanoparticles (LNPs) is essential for predicting biological efficacy, maintaining critical N/P ratios, and meeting stringent regulatory CMC thresholds. Creative Proteomics offers verified single-run quantitative assays by RP-UHPLC-CAD and high-resolution LC-MS/MS, resolving ionizable lipids, helper phospholipids, cholesterol, and PEGylated lipids in formulated nanomedicines.
Why choose us: Simultaneous 4-in-1 quantification · universal mass-sensitive CAD response · baseline separation of PEG-lipid polydispersity · microfluidic DOE support
What we provide: Absolute concentration (mg/mL) · certified molar percentage (mol%) · true N/P ratio calculations · lyso-lipid & degradant tracking
Problems we solve: Formulation drift during TFF · PEG-lipid surface shedding · unreacted ionizable raw material impurities · non-chromophoric cholesterol quantification
Submit Your Request Now
×Our services have earned the trust of companies, schools, and organizations globally, and we remain dedicated to maintaining that trust.









In lipid nanoparticle (LNP) formulations, biological potency is dictated by the precise stoichiometric assembly of four distinct lipid entities. While theoretical calculations assume 100% encapsulation and uniform assembly, physical realities during microfluidic mixing, ultrafiltration, and storage inevitably introduce composition drift.
A standard LNP comprises an ionizable cationic lipid (typically 40–50 mol%), a neutral helper phospholipid (e.g., DSPC or DOPE, ~10 mol%), cholesterol (38–40 mol%), and a PEGylated lipid (1.0–2.0 mol%). Minor variations in the actual molar ratio profoundly shift formulation critical quality attributes (CQAs). A 2% depletion in ionizable lipid decreases the effective N/P ratio, leading to premature cargo release or incomplete encapsulation. Conversely, preferential loss or excessive desorption of PEG-lipids alters average particle diameter (Z-average), polydispersity index (PDI), and circulation half-life. Our quantitative service bridges the gap between nominal recipe formulation and actual nanoparticle composition through verified single-run chromatographic analysis.
Where formulation screening focuses on traditional bilayer vesicles without nucleic acid condensation cores, characterization is supported through our liposome characterization services. For downstream systemic biodistribution and tissue-level trafficking, studies can be paired with our LNP & exosome delivery profiling.
At Creative Proteomics, we offer specialized analytical modules tailored for biopharmaceutical research, drug product development, and academic nanomedicine programs.
Stoichiometric Molar Ratio Determination
Accurate quantification of absolute concentration (mg/mL) and relative molar fraction (mol%) for all 4 lipid classes in a single chromatographic separation.
Effective N/P Ratio Calculation
Direct correlation of measured intact ionizable lipid molarity against cargo nucleic acid phosphate concentration to certify true functional N/P stoichiometry.
Encapsulated vs. Free Lipid Fractionation
Centrifugal ultrafiltration and solid-phase extraction protocols separating intact assembled particles from free unencapsulated lipid monomers.
PEG-Lipid Shedding & Stability Profiling
Quantitative tracking of PEG-lipid desorption kinetics in serum or storage buffer over accelerated stability and freeze-thaw cycles.
Degradation & Hydrolysis Impurity Tracking
Simultaneous profiling of lyso-phospholipids (LPC, LPE), oxidized sterols, and cleaved ionizable lipid tails in degraded LNP lots.
Batch-to-Batch Comparability
Assessing formula reproducibility across microfluidic batches, scale-up runs, and storage conditions with certified calibration curves and internal standard control.
Each of the four lipid components governs a distinct biological and structural mechanism in nucleic acid delivery. Below are the quantitative targets and analytical methodologies.
The ionizable lipid represents the functional cornerstone of LNP technology, engineered with an apparent pKa between 6.0 and 7.0. It condenses mRNA/siRNA in acidic mixing conditions and triggers endosomal membrane destabilization inside target cells.
| Analytical Feature | Specification & Details |
|---|---|
| Representative Targets | DLin-MC3-DMA (MC3), ALC-0315, SM-102, C12-200, LP01, and custom proprietary synthetic ionizable lipids |
| Critical Readouts | Absolute concentration (mg/mL), actual mol%, unreacted raw materials, and N-oxide / hydrolysis degradants |
| Analytical Method | RP-UHPLC with Charged Aerosol Detection (CAD) and high-resolution Q Exactive Orbitrap MS/MS confirmation |
Zwitterionic helper lipids support lamellar bilayer phase integrity. DSPC provides high phase transition temperatures ensuring rigid encapsulation, whereas unsaturated DOPE adopts non-lamellar hexagonal II structures that promote membrane fusion. When comprehensive fatty acid chain distribution or lysolipid degradation profiling is required alongside intact ratios, analysis can be coupled with our phosphatidylcholine analysis and phosphatidylethanolamine analysis workflows.
| Analytical Feature | Specification & Details |
|---|---|
| Representative Targets | 1,2-distearoyl-sn-glycero-3-phosphocholine (DSPC), 1,2-dioleoyl-sn-glycero-3-phosphoethanolamine (DOPE), DPPC |
| Critical Readouts | Phospholipid mass concentration, molar ratio percentage, and accumulation of lyso-phospholipids (LPC / LPE) |
| Analytical Method | HILIC and reversed-phase UHPLC with CAD mass quantification and tandem MS verification |
Cholesterol fills interstitial voids between bulky acyl chains, preventing payload leakage, enhancing structural integrity, and modulating intracellular trafficking kinetics. For broader investigations into sterol purity, precursor accumulation, or oxidation products, assays are supported by our dedicated cholesterol targeted lipidomics platform.
| Analytical Feature | Specification & Details |
|---|---|
| Representative Targets | Cholesterol (plant-derived or synthetic), β-sitosterol, 7-dehydrocholesterol, and oxidized sterol impurities |
| Critical Readouts | Zero native UV chromophore at standard wavelengths; quantified via CAD mass response or atmospheric pressure chemical ionization (APCI) MS |
| Analytical Method | Reversed-phase UHPLC with CAD universal mass response or APCI-MS/MS for non-chromophoric sterols |
PEG-conjugated lipids typically comprise only 1.0–2.0 mol% of the total formulation. Despite low molarity, PEG length and anchor chain length (C14 vs C18) dictate particle diameter and in vivo circulation half-life. Complementary raw material verification and phospholipid backbone characterization can also be correlated through our phospholipids analysis service.
| Analytical Feature | Specification & Details |
|---|---|
| Representative Targets | 1,2-dimyristoyl-rac-glycero-3-methoxypolyethylene glycol-2000 (DMG-PEG2000), ALC-0159, DSPE-mPEG2000 |
| Critical Readouts | Polydispersity deconvolution, true PEG-lipid recovery post-TFF purification, and desorption kinetics monitoring |
| Analytical Method | RP-UHPLC with post-column inverse gradient CAD and high-resolution Orbitrap mass deconvolution |
Accurate molar ratio certification requires analytical detectors whose response factors do not depend on optical absorption. The table below outlines detector performance across LNP quality attributes.
| Parameter / Feature | Standard HPLC-UV | Charged Aerosol Detection (CAD) | Triple Quad LC-MS/MS | High-Res Orbitrap MS |
|---|---|---|---|---|
| Chromophore Dependency | Mandatory (>210 nm) | Universal (non-volatile mass) | None (ionization dependent) | None (exact mass) |
| Sterol & Saturated Sensitivity | Very poor / undetected | High and uniform | Moderate (requires APCI) | High (sub-ppm mass accuracy) |
| Dynamic Linear Range | Narrow at low UV | Wide (>3 orders with power fit) | Wide (>4 orders) | Wide (>3 orders) |
| Solvent Gradient Compatibility | Baseline drift with THF/IPA | Inverse gradient compensation | High tolerance | High tolerance |
| Ideal Project Application | Crude screening of aromatic targets | Simultaneous 4-in-1 mol% assay | Trace biodistribution in tissues | Impurity & N-oxide confirmation |
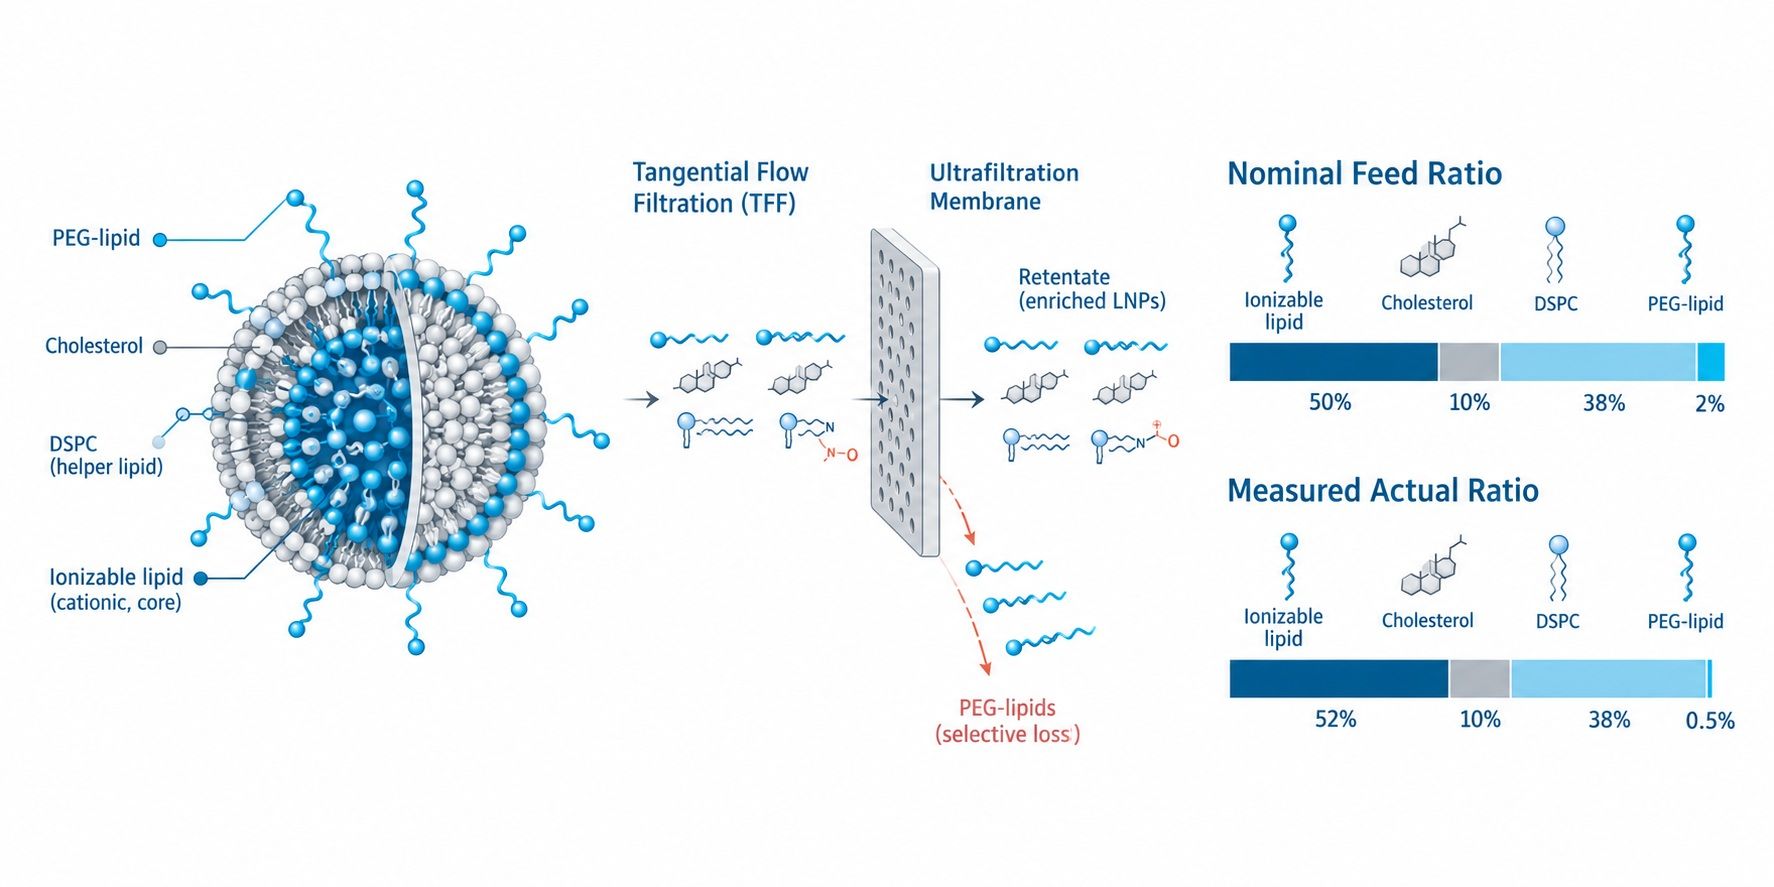 Orthogonal detection comparison: highlighting CAD uniform response for simultaneous quantification of cholesterol, phospholipids, PEG-lipids, and ionizable cationic lipids without chromophore extinction bias.
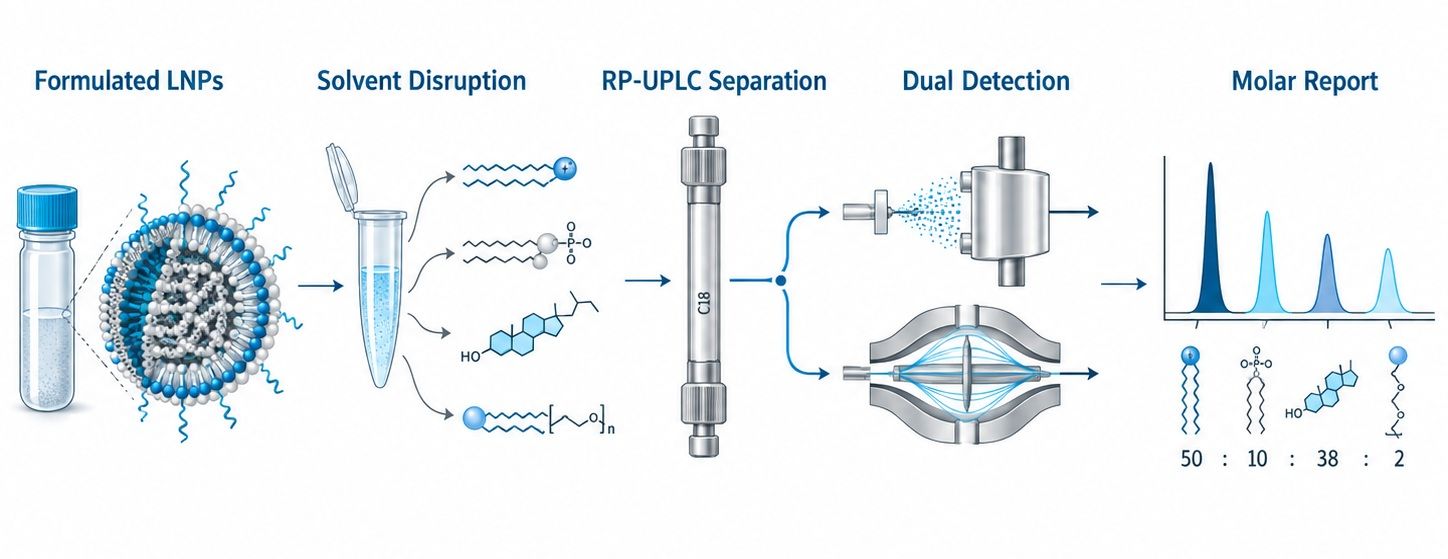 Comprehensive five-stage testing workflow: from non-destructive sample preparation and single-run UHPLC-CAD separation to certified molar ratio reporting and regulatory submission support.
Our quantitative workflow is engineered to minimize sample handling artefacts and avoid premature lipid oxidation. Samples undergo mild organic disruption before automated auto-sampler injection. Run data are processed using power-function calibration models against certified primary reference standards, yielding quantitative molar tables and CQA comparability indices.
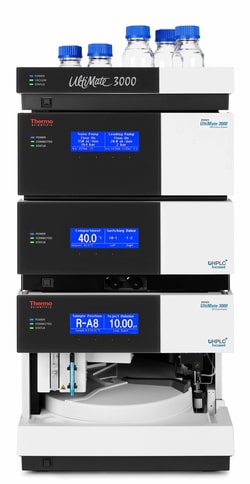
Thermo Scientific Vanquish Horizon UHPLC + CAD
Biocompatible fluidics paired with CAD for uniform non-volatile lipid response
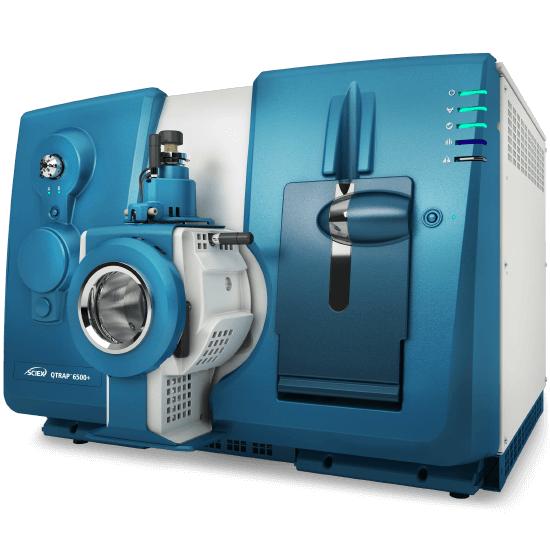
Thermo Fisher Q Exactive HF-X Orbitrap MS
High-resolution mass spectrometry (<2 ppm) for structural verification
| Parameter | Analytical Condition | Technical Significance |
|---|---|---|
| Stationary Phase | Waters ACQUITY Premier CSH C18 (2.1 × 100 mm, 1.7 μm) | Positively charged surface prevents peak tailing of basic ionizable lipids |
| Mobile Phase A / B | Water / Acetonitrile / Isopropanol with 0.1% Formic Acid & 10 mM Ammonium Formate | Maintains ion-pairing control and optimizes CAD aerosol evaporation kinetics |
| Gradient Scheme | Inverse gradient with secondary pump compensation (50–100% B over 16 min) | Neutralizes nebulizer response changes across steep organic elutions |
| CAD Settings | Evaporator temp: 35°C; Data rate: 10 Hz; Filter: 3.6 s; Power function: 1.20–1.45 | Linearizes non-linear mass response curves across 0.5–500 μg/mL range |
Results we provide:
Data analysis:
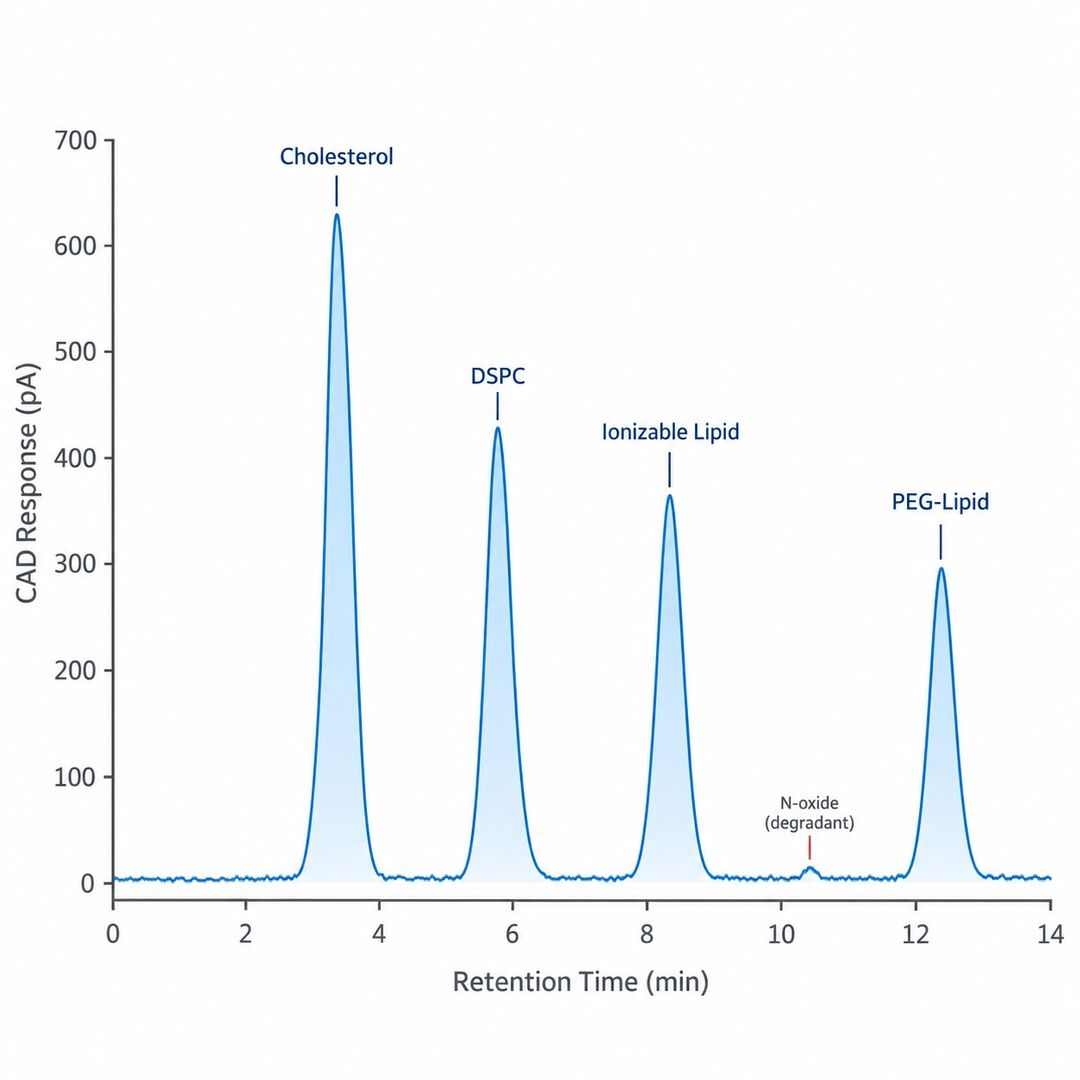
Baseline separation of 4 LNP lipid components on CSH C18 with CAD detection.
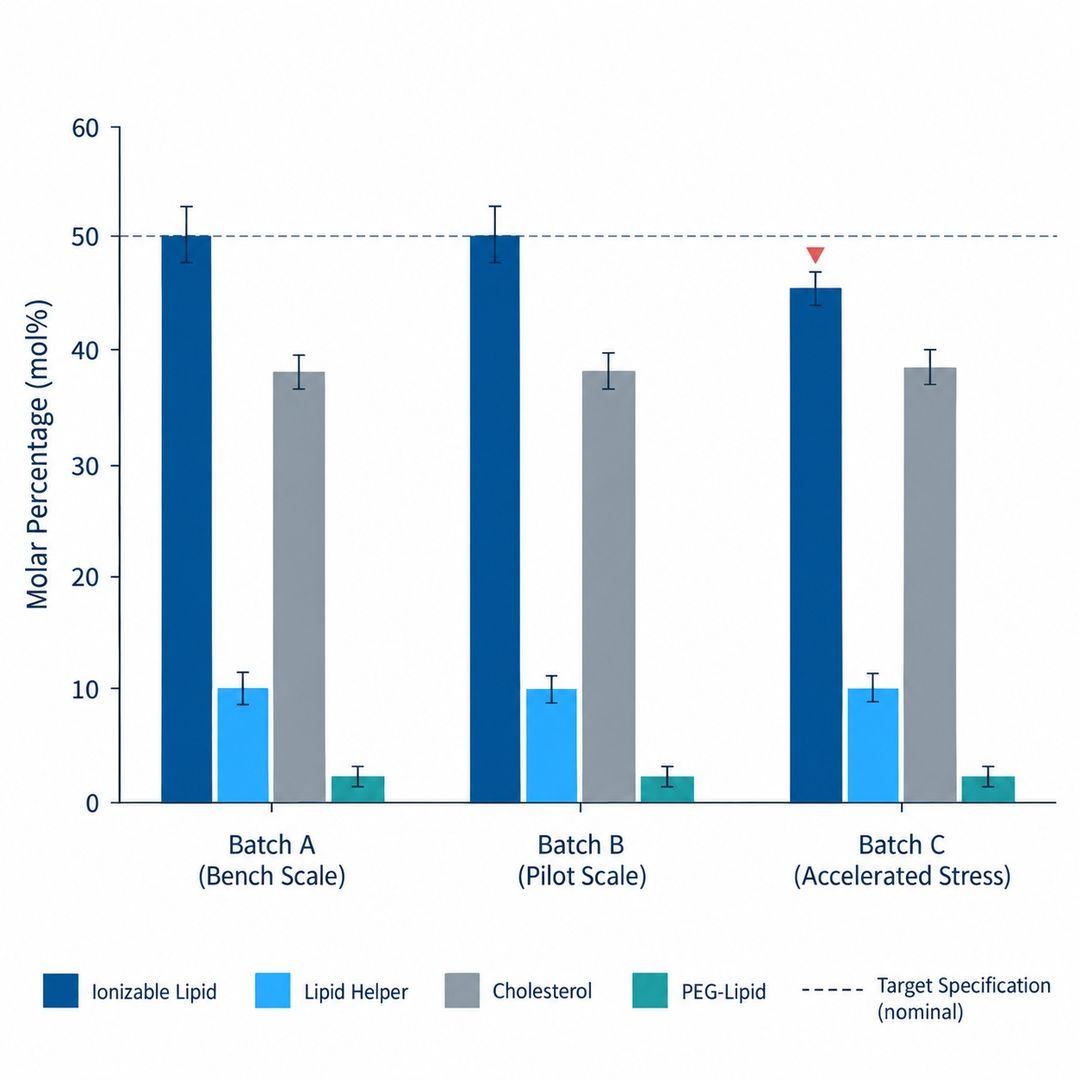
Molar ratio certification comparing measured mol% against nominal recipe values.
Microfluidic Formulation Screening & DOE
In Design-of-Experiments (DOE) exploring total flow rate (TFR), flow rate ratio (FRR), and aqueous-to-solvent ratios, our molar ratio testing directly verifies whether mixer physics faithfully translates target recipes into intended nanoparticle structures.
TFF Purification & Downstream Recovery
Tangential flow filtration (TFF) and diafiltration frequently strip weakly anchored PEG-lipids. Monitoring the four lipids across diafiltration volumes pinpoints membrane retention cut-offs and optimizes washing parameters.
Accelerated Stability & Stress Testing
Quantify ester cleavage, phospholipid hydrolysis, and PEG desorption under thermal, acidic, and freeze-thaw stresses to establish shelf-life boundaries and container closure compatibility.
Preclinical CMC Dossier Characterization
Deliver robust chromatographic and spectrometric documentation of formulation stoichiometry and impurity limits to de-risk IND-enabling preclinical studies and academic grant milestones.
| Parameter | Requirement / Recommendation |
|---|---|
| Sample Matrix | Formulated LNPs (suspension), crude microfluidic reaction mixtures, or raw lipid mixtures |
| Minimum Volume / Mass | 50–200 μL per replicate (minimum total lipid concentration >0.2 mg/mL) |
| Buffer Compatibility | PBS, Tris, citrate, sucrose/trehalose cryoprotectants (lyophilized or liquid) |
| Shipping Conditions | Frozen on dry ice (−80°C) or refrigerated cold packs (±4°C) depending on stability profile |
| Documentation Needed | Target recipe molar ratios, candidate ionizable lipid chemical structure or formula weight |
Why can't HPLC with standard UV detection accurately quantify all four LNP lipids?
Standard UV detectors rely on chromophores (such as aromatic rings or conjugated double bonds) to absorb light. Cholesterol and saturated helper phospholipids (such as DSPC or DPPC) possess no native chromophores and yield virtually zero absorbance above 210 nm. Monitoring at 200–205 nm causes severe baseline drift and baseline noise from organic mobile phases. Charged Aerosol Detection (CAD) is a universal mass-sensitive technology that measures particle charge proportional to analyte mass, ensuring accurate, uniform response factors across all lipid classes without chromophore bias.
How does actual molar ratio determination impact the N/P ratio calculation?
The N/P ratio represents the molar ratio of positively charged ionizable amine groups (N) to negatively charged nucleic acid phosphate backbones (P). By measuring the exact molarity of the intact, non-degraded ionizable lipid in your formulated sample and combining it with your known or measured cargo concentration, we calculate the true functional N/P ratio.
What is the typical turnaround time for LNP composition testing?
Standard turnaround time for established LNP compositions (e.g., MC3, SM-102, ALC-0315 formulations) is 10–15 business days following sample receipt. Expedited testing is available upon request for time-sensitive formulation screening campaigns.
What development stages does this service support?
Our compositional and molar ratio analysis platform supports early discovery, preclinical formulation optimization, process development, and comparative stability evaluation. We deliver comprehensive research-grade characterization data to accelerate candidate selection and formulation refinement.
References
Applications:
Online Inquiry
CONTACT US