Our services have earned the trust of companies, schools, and organizations globally, and we remain dedicated to maintaining that trust.
What Is Sphingomyelin and Why Analyze It?
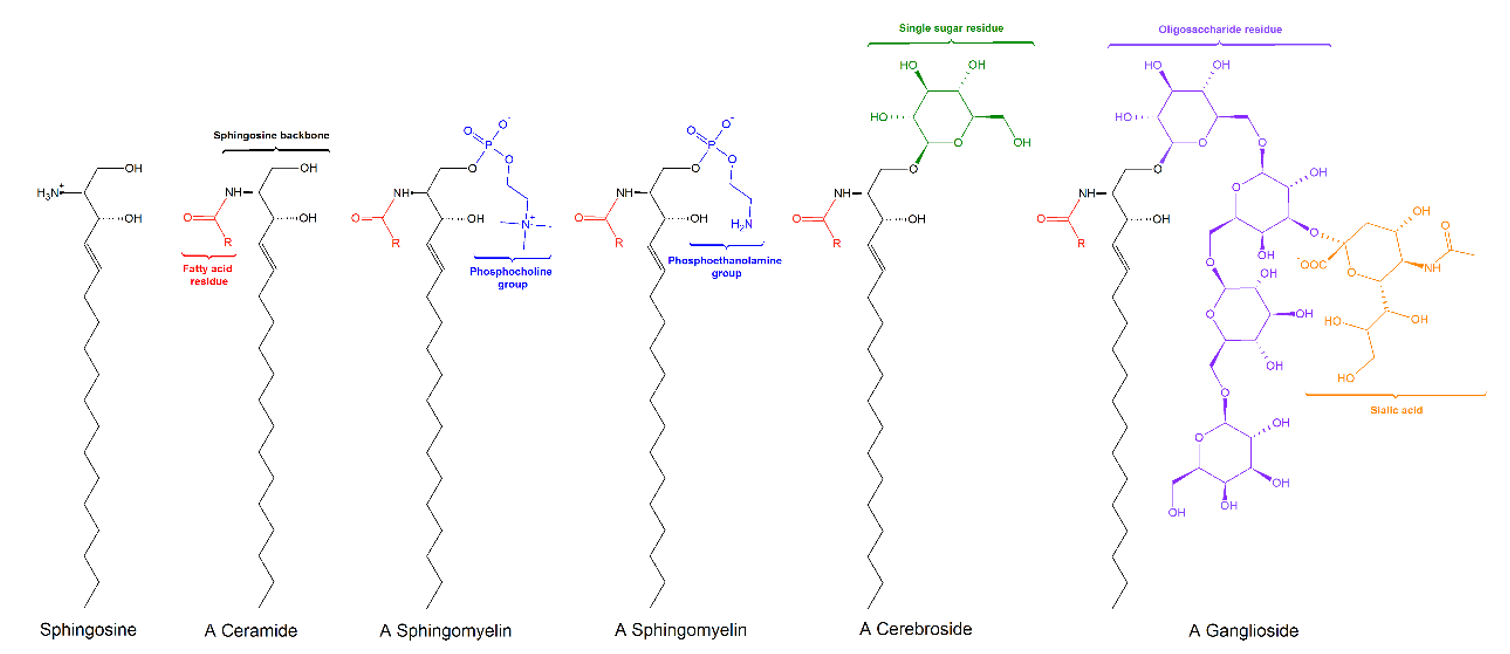
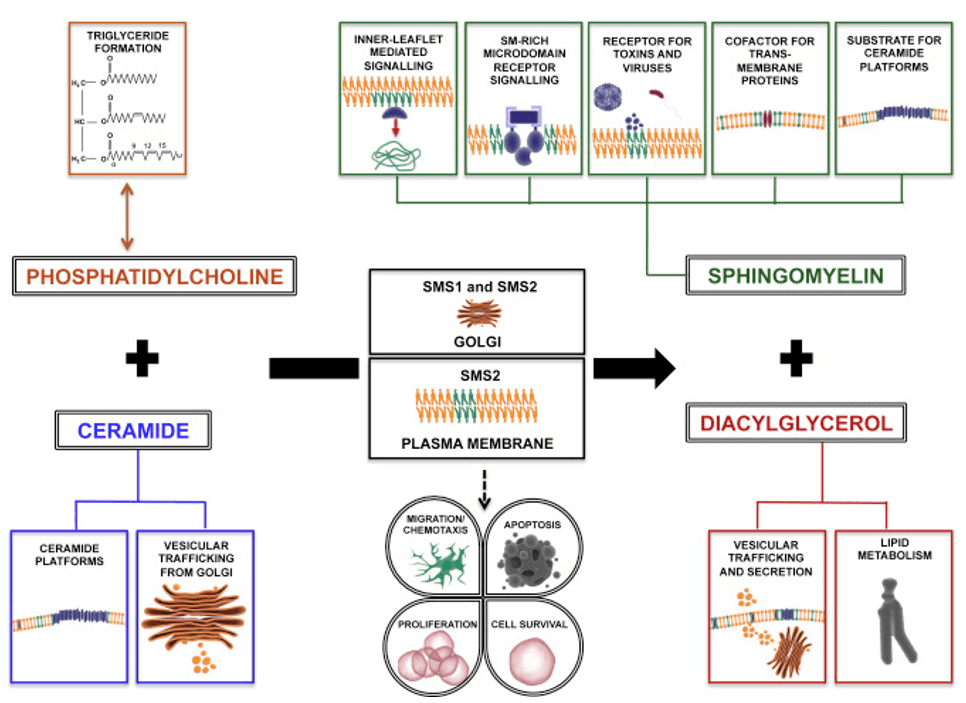
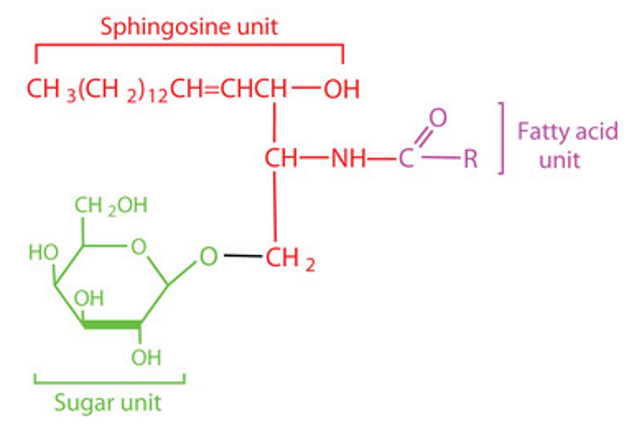
Sphingomyelin is a phosphosphingolipid composed of a ceramide backbone (sphingosine + fatty acid) linked to a phosphocholine head group. It is concentrated in the outer leaflet of the plasma membrane, where it associates with cholesterol to form liquid-ordered domains (lipid rafts) that scaffold signal transduction complexes. The controlled hydrolysis of SM by acid sphingomyelinase (aSMase) and neutral sphingomyelinase (nSMase) generates ceramide — a bioactive lipid that drives apoptosis, inflammation, and membrane reorganization. Consequently, the SM/ceramide ratio is a functional index of sphingolipid pathway balance with direct relevance to atherosclerosis (LDL-associated SM uptake by arterial wall macrophages), Alzheimer's disease (aSMase activation by Aβ), and cancer (SM depletion sensitizing cells to chemotherapy). In addition to its signaling roles, SM is a major dietary sphingolipid in milk, egg, and meat — with emerging evidence for its role in gut barrier integrity and colon cancer prevention.
Sphingomyelin Analysis Service in Creative Proteomics
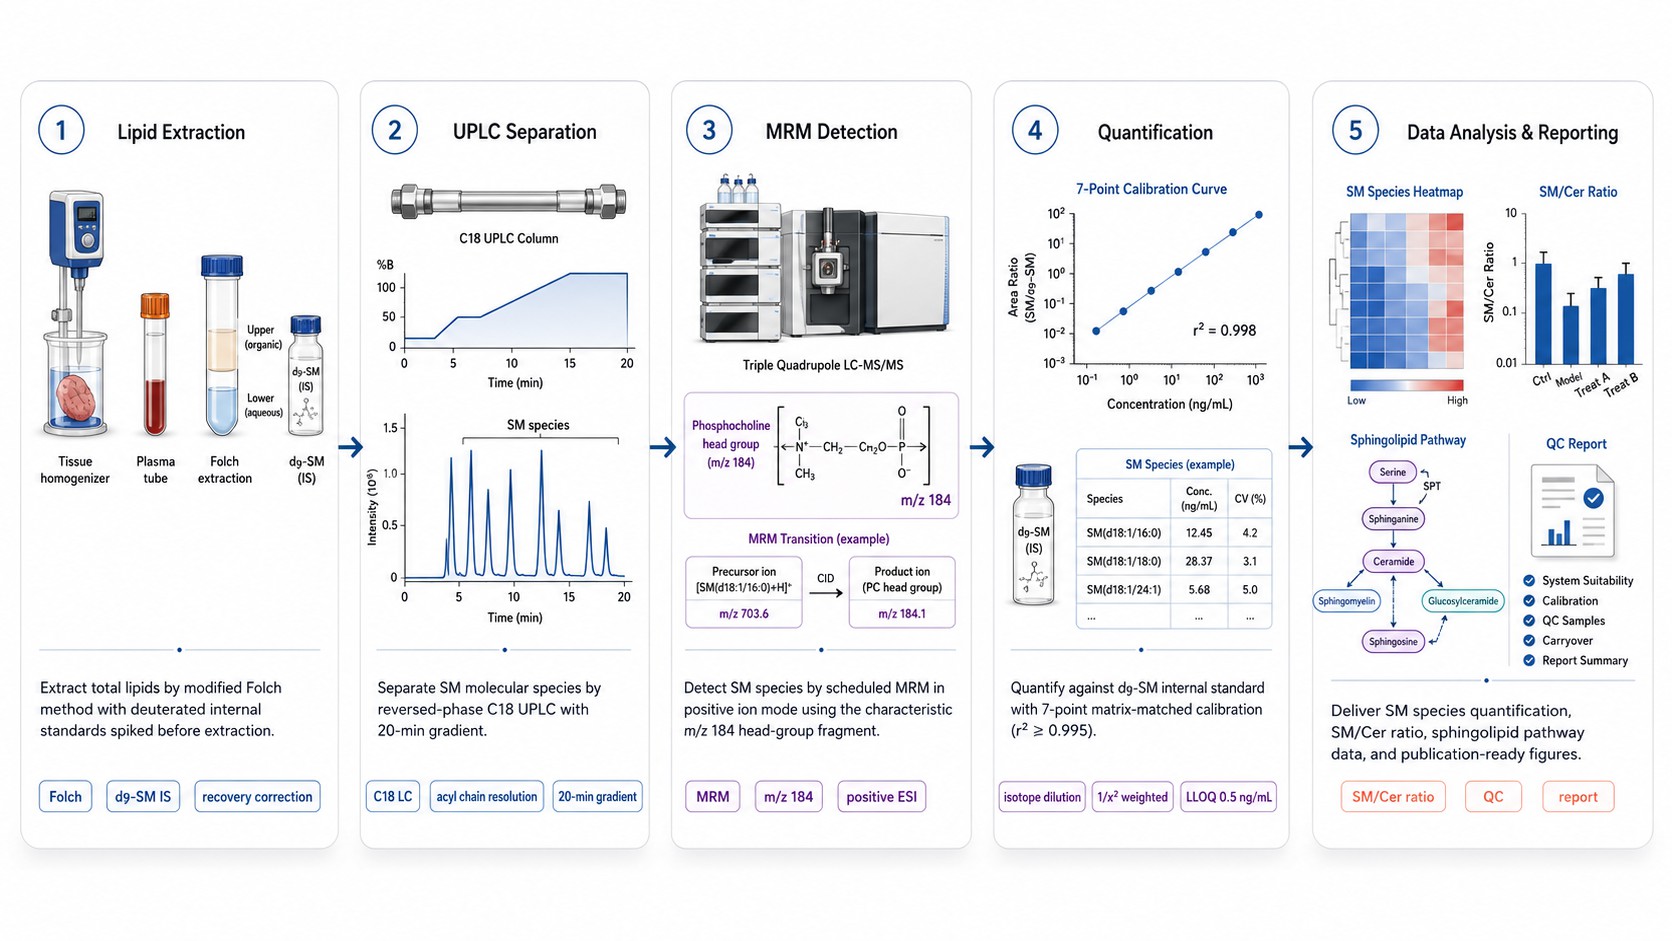
Sphingomyelin species are quantified by reversed-phase UPLC-MRM on a triple quadrupole platform with positive-ion electrospray ionization, using the characteristic phosphocholine head-group fragment (m/z 184) for SM detection and the m/z 264 fragment for ceramide. Deuterated internal standards (SM d18:1/12:0-d9, Cer d18:1/12:0-d7) are spiked before lipid extraction for recovery correction and matrix-effect compensation. The method achieves baseline resolution of SM species by acyl chain length and unsaturation, with an LLOQ of 0.5 ng/mL.
SM Species Profiling Panel
Quantify 40+ sphingomyelin molecular species from SM d18:1/14:0 to SM d18:1/26:1 — covering the full range of mammalian SM acyl chain diversity. Report includes individual species abundance (pmol/mg protein or nmol/mL), total SM content, and acyl chain composition distribution. Used for membrane lipidomics, lipoprotein characterization, and tissue-specific SM profiling.
SM/Ceramide Ratio Panel
Simultaneous quantification of SM and ceramide species from the same sample extract, with calculation of total SM/Cer and species-level SM/Cer ratios. This panel is the primary readout for sphingomyelinase activity assays, acid sphingomyelinase deficiency (ASMD / Niemann-Pick), and apoptosis signaling studies where SM hydrolysis drives ceramide accumulation.
Sphingolipid Pathway Panel
Targeted quantification of the core sphingolipid metabolic pathway — SM, ceramide (Cer), sphingosine (Sph), and sphingosine-1-phosphate (S1P) — from a single sample. This pathway-level approach identifies whether changes in SM are due to de novo synthesis, sphingomyelinase hydrolysis, or sphingosine kinase activity. Includes dihydrosphingomyelin and dihydroceramide for de novo pathway assessment.
Dietary Sphingomyelin Analysis
Quantify SM content and species composition in food matrices — milk and dairy products, egg yolk, meat, and infant formula. Method includes matrix-specific extraction protocols with recovery validation. Useful for functional food development, infant nutrition research, and studies of dietary SM effects on gut barrier integrity and colon cancer prevention.
Detectable Sphingomyelin Species and Related Sphingolipids
- SM Species
- Related Sphingolipids
Sphingomyelin (SM) Molecular Species
SM species are identified by the sphingoid base (predominantly d18:1) and N-linked fatty acyl chain. The following table presents representative SM species routinely detected in human plasma and tissue.
| SM Species | Acyl Chain | Typical Abundance (Plasma) | Category | Biological Context |
|---|
| SM d18:1/14:0 | C14:0 (myristic) | Low | Short-chain SM | Minor plasma species; elevated in some cancer cell lines |
| SM d18:1/16:0 | C16:0 (palmitic) | Very High | Major SM species | Most abundant plasma SM; predominant in LDL and VLDL particles; substrate for SMS2 in liver |
| SM d18:1/18:0 | C18:0 (stearic) | High | Major SM species | Second most abundant plasma SM; synthesized by SMS1 in Golgi |
| SM d18:1/18:1 | C18:1 (oleic) | Moderate | Unsaturated SM | Minor unsaturated species; increased in some metabolic conditions |
| SM d18:1/20:0 | C20:0 (arachidic) | Low-Moderate | Medium-chain SM | Minor species; increases in LDL of hypercholesterolemic subjects |
| SM d18:1/22:0 | C22:0 (behenic) | High | Long-chain SM | Third most abundant plasma SM; enriched in HDL; associated with cardiovascular risk |
| SM d18:1/23:0 | C23:0 (tricosanoic) | Moderate | Odd-chain SM | Odd-chain species; dietary biomarker for dairy fat intake |
| SM d18:1/24:0 | C24:0 (lignoceric) | High | Very long-chain SM | Enriched in brain myelin and HDL; LDL-associated SM d18:1/24:0 linked to atherosclerosis progression |
| SM d18:1/24:1 | C24:1 (nervonic) | High | Very long-chain SM | Major myelin SM; brain-enriched; nervonic acid from dietary sources incorporated into CNS sphingolipids |
| SM d18:1/26:0 | C26:0 (cerotic) | Low | Ultra long-chain SM | Trace species in most tissues; enriched in testis and sperm |
For studies investigating sphingolipid metabolism and signaling, the following analytes are quantified alongside SM from the same sample extract. This integrated approach resolves whether SM changes reflect synthesis, hydrolysis, or downstream signaling.
| Analyte | Category | Pathway Role | LLOQ | Key Application |
|---|
| Ceramide (Cer) | SM hydrolysis product | Pro-apoptotic; generated by SMases; substrate for sphingomyelin synthases (SMS1/2) | 0.5 ng/mL | SM/Cer ratio; apoptosis signaling; Niemann-Pick disease |
| Dihydroceramide (dhCer) | De novo synthesis intermediate | Ceramide precursor in de novo pathway; synthesized by CerS1-6 | 0.5 ng/mL | Distinguishes de novo synthesis from SMase hydrolysis |
| Sphingosine (Sph) | Cer hydrolysis product | Generated by ceramidases; precursor for S1P | 0.2 ng/mL | Ceramidase activity; sphingolipid catabolic flux |
| Sphingosine-1-Phosphate (S1P) | Sphingosine kinase product | Pro-survival signaling lipid; S1P receptor ligand | 0.1 ng/mL | S1P/Sph ratio; immune cell trafficking; vascular biology |
| Dihydrosphingomyelin (dhSM) | De novo SM species | Saturated sphingoid base (d18:0); synthesized from dhCer by SMS | 0.5 ng/mL | De novo SM synthesis marker; distinguishes synthesis from turnover |
Why Choose Our Sphingomyelin Analysis Platform
- Species-level SM coverage: 40+ molecular species from SM d18:1/14:0 to d18:1/26:1, with baseline separation by acyl chain length and unsaturation on UPLC C18 (1.7 μm).
- Integrated pathway readout: SM, Cer, dhCer, Sph, S1P, and dhSM quantified from the same sample — resolving whether SM changes reflect de novo synthesis, sphingomyelinase activity, or sphingosine kinase flux.
- Quantitative rigor: Deuterated internal standards (d9-SM, d7-Cer) spiked before extraction; 1/x2 weighted calibration with r2 ≥ 0.995; intra-assay CV below 8% at the LLOQ of 0.5 ng/mL.
- Characteristic fragment-based detection: MRM using the phosphocholine head group fragment (m/z 184) for SM-specific detection eliminates interference from other sphingolipid classes without the phosphocholine moiety.
- Dietary SM capability: Validated extraction protocols for complex food matrices — milk, dairy, egg yolk, meat — with species profiling for functional food and infant nutrition research.
- Multi-matrix compatibility: Pre-optimized methods for plasma/serum, tissue (brain, liver, aorta), cultured cells, and lipid extracts with matrix-specific calibration.
- Publication-ready data delivery: Raw MRM chromatograms, calibration curve metrics, and QC reports provided alongside processed data tables for independent verification.
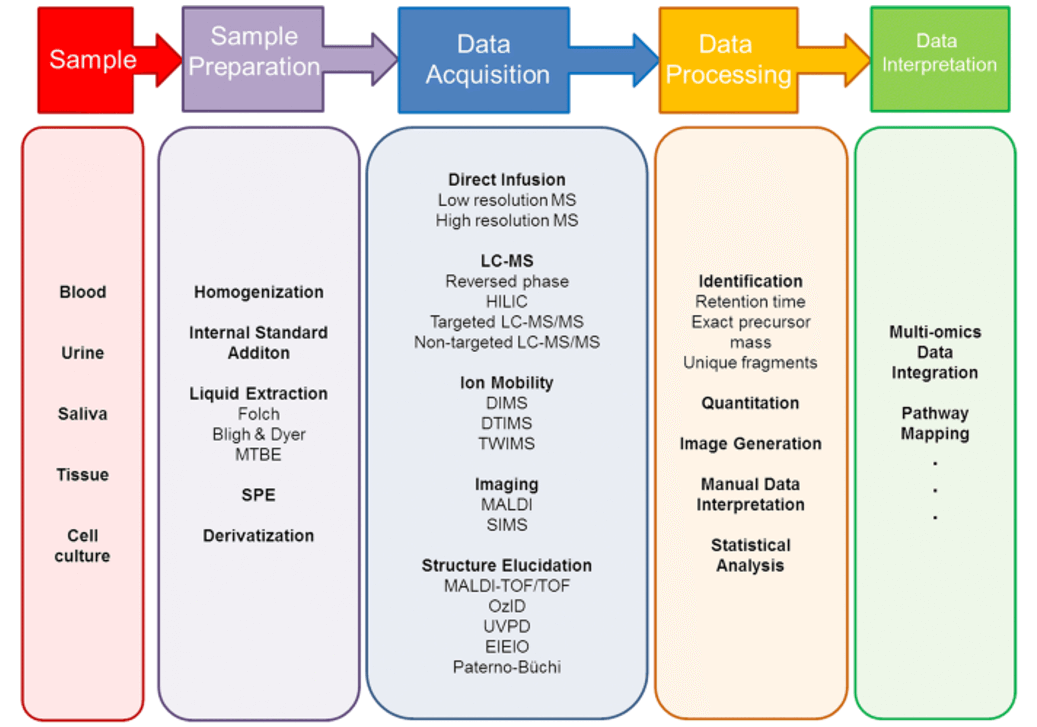
Sphingomyelin Analysis Workflow
Technology Platform for Sphingomyelin Analysis
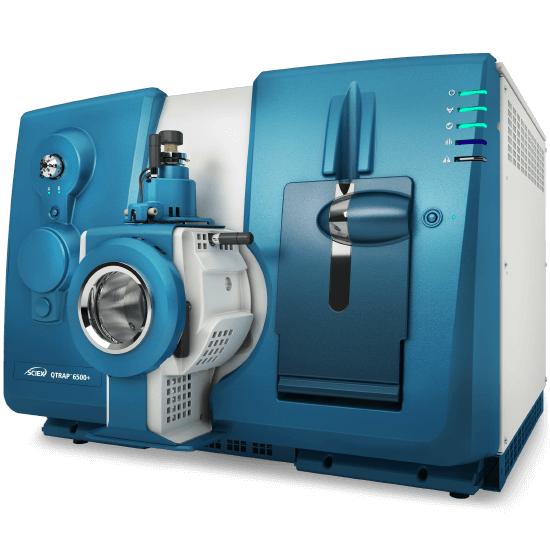
SCIEX Triple Quad 6500+ — scheduled MRM with precursor ion scan of m/z 184 for phosphocholine-specific SM detection and m/z 264 for ceramide quantification.
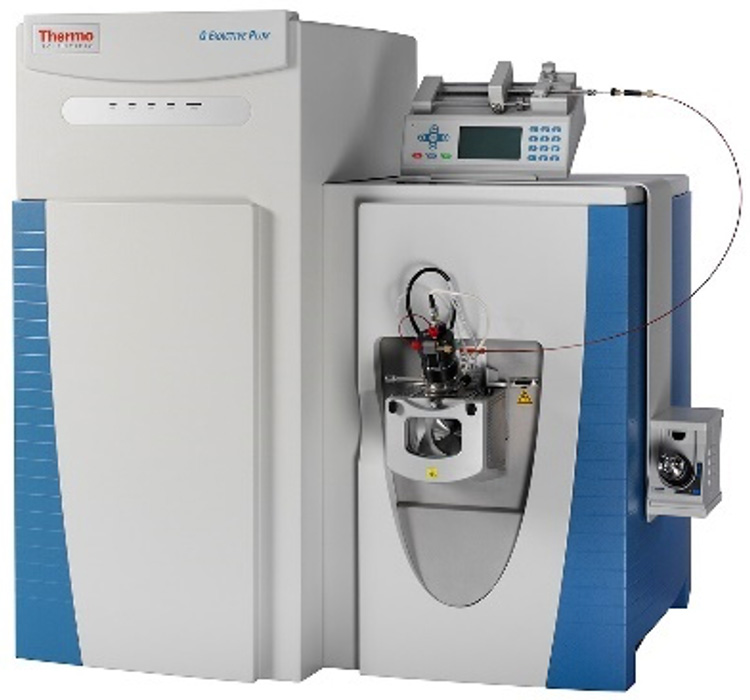
Thermo Q Exactive HF-X Orbitrap — high-resolution confirmation of SM acyl chain composition at 120,000 resolution for novel species identification.
LC-MS/MS Method Specifications
| Parameter | Specification |
|---|
| Platform | SCIEX Triple Quad 6500+ with Turbo V ion source; positive ion ESI |
| SM Detection | Precursor ion scan of m/z 184 (phosphocholine head group) or MRM transitions for individual species |
| Ceramide Detection | MRM transitions monitoring m/z 264 fragment (sphingoid base backbone) |
| Chromatography | UPLC C18 (2.1 × 100 mm, 1.7 μm); 20-min gradient; baseline resolution of SM species by acyl chain length |
| Internal Standards | SM d18:1/12:0-d9, Cer d18:1/12:0-d7; spiked before lipid extraction |
| Precision | Intra-assay CV below 8%; inter-assay CV below 12% |
| Calibration | 7-point matrix-matched; 1/x2 weighted; r2 ≥ 0.995 |
| SM/Cer Ratio Resolution | Simultaneous acquisition of SM and Cer MRM transitions from the same extract; species-level and total SM/Cer ratio reported |
Sphingomyelin Analysis — Results & Data
Sphingomyelin Quantification Report
Results provided:
- Species-level SM abundance table (pmol/mg protein or nmol/mL) with deuterated IS recovery per sample
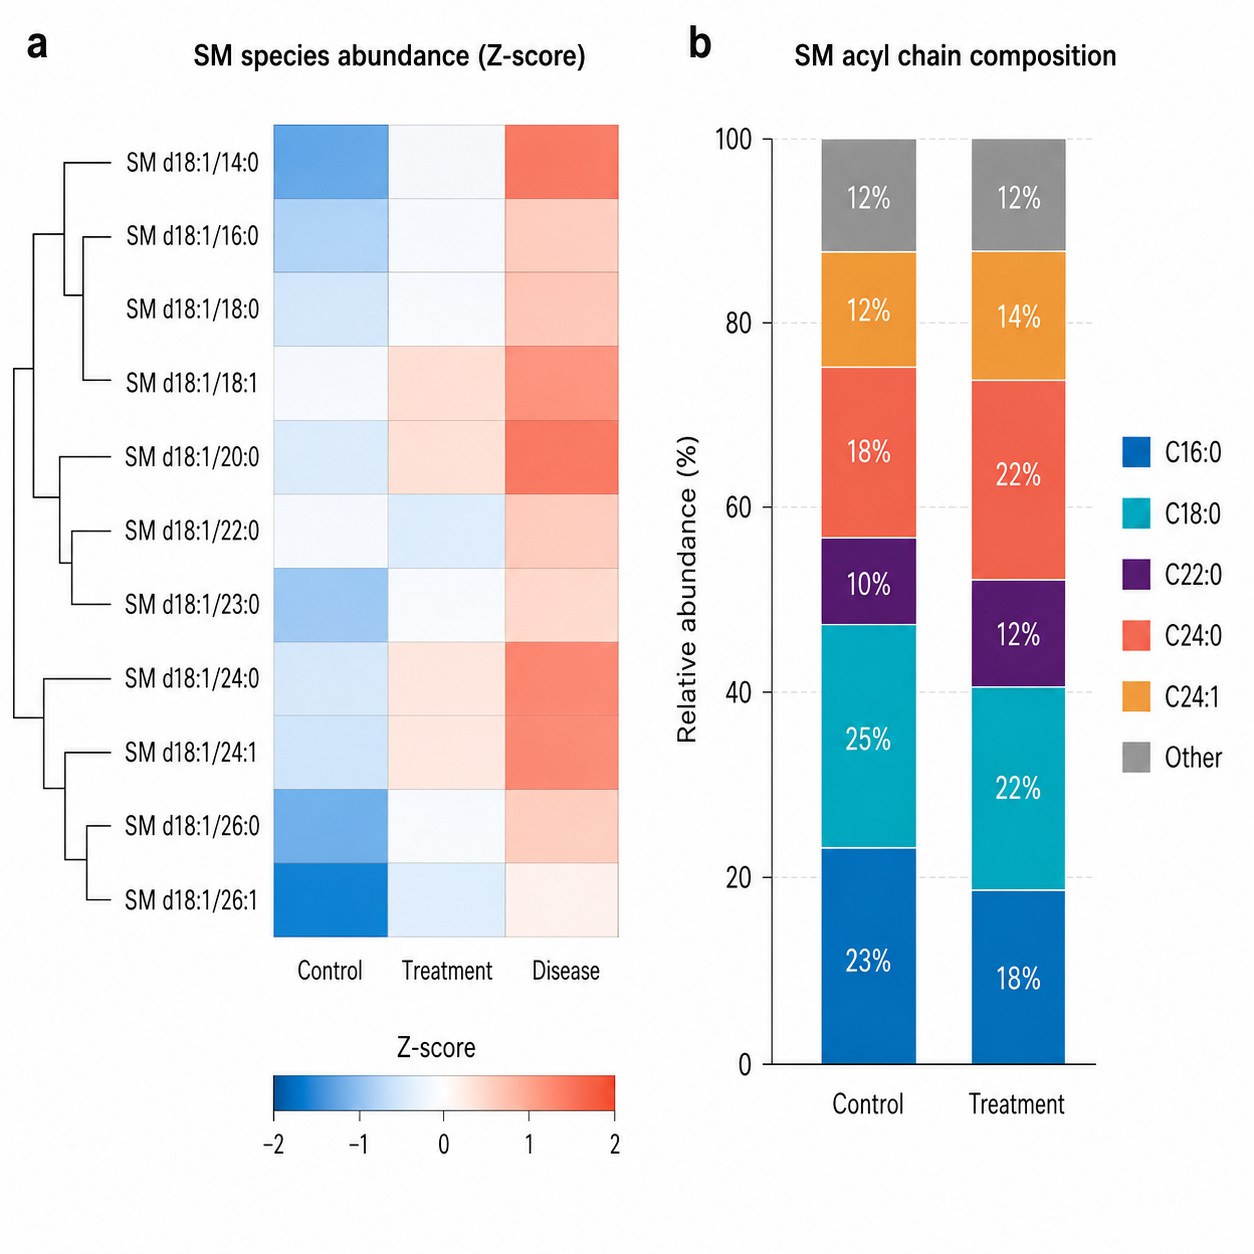
- SM acyl chain composition distribution — percentage of C16:0, C18:0, C22:0, C24:0, C24:1 species
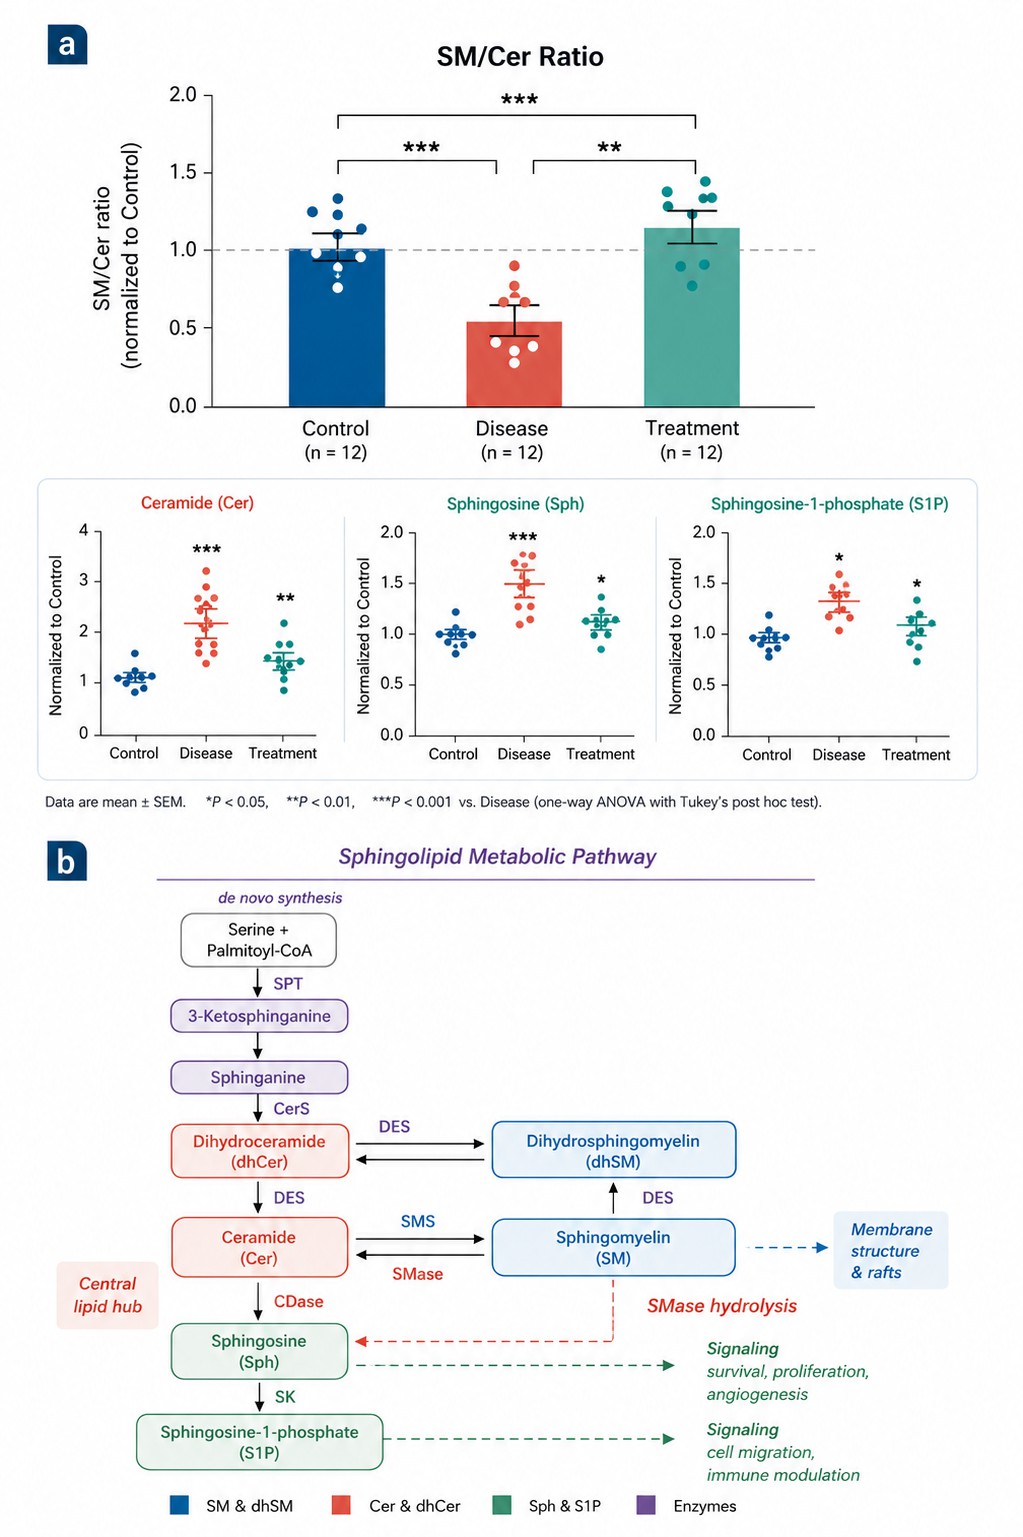
- Total SM content and SM/ceramide ratio (total and species-resolved)
SM species abundance heatmap across plasma samples showing acyl chain composition shifts between experimental groups.
SM/Cer ratio and sphingolipid pathway metabolite levels across experimental conditions.
Sphingolipid Pathway Analysis
- SM → Cer → Sph → S1P pathway flux assessment from a single sample extract
- SM/Cer ratio and S1P/Sph ratio as functional indices of sphingomyelinase and sphingosine kinase activity
- dhCer/dhSM ratio for distinguishing de novo synthesis from SMase-mediated hydrolysis
Statistical Analysis & Visualization
- Group comparisons with FDR-corrected significance per SM species
- Principal component analysis (PCA) of SM species profiles; volcano plots; heatmaps
- KEGG sphingolipid metabolism pathway with fold-change overlay
Explore our Targeted Lipidomics Solutions brochure to learn more about sphingomyelin analysis and our complete sphingolipid profiling capabilities.
Download Brochure
What Sphingomyelin Analysis Is Used For
Atherosclerosis & Cardiovascular Disease
Plasma SM levels — particularly SM d18:1/16:0 in LDL particles — are independently associated with coronary artery disease and atherosclerotic plaque progression. SM retained in the arterial wall is hydrolyzed by secretory sphingomyelinase to ceramide, promoting LDL aggregation and macrophage foam cell formation. Species-level SM profiling in isolated lipoproteins provides mechanistic insight beyond total SM measurement.
Myelin Biology & Neurodegeneration
SM d18:1/24:1 and d18:1/24:0 are the predominant sphingolipids in myelin sheaths, where they contribute to axon insulation and saltatory conduction. SM metabolism is disrupted in multiple sclerosis (altered SM/Cer ratio in normal-appearing white matter), Alzheimer's disease (aSMase activation by amyloid-β), and Niemann-Pick disease types A/B (ASM deficiency with massive SM accumulation).
Cancer Sphingolipid Signaling
SM depletion and ceramide accumulation are hallmarks of chemotherapy-induced apoptosis across multiple cancer types. The SM/ceramide ratio is a pharmacodynamic biomarker for ceramide-generating therapies (doxorubicin, radiation, fenretinide). SM synthase (SMS) overexpression is reported in multidrug-resistant cancer cells, making SMS a therapeutic target.
Dietary Sphingomyelin & Gut Health
Dietary SM from milk, egg, and meat is hydrolyzed by intestinal alkaline sphingomyelinase to ceramide and sphingosine, which are further metabolized by colonocytes. Epidemiological and animal studies suggest dietary SM inhibits colon carcinogenesis. SM species profiling in food matrices and fecal samples supports functional food development and nutritional intervention studies.
Sample Requirements for Sphingomyelin Analysis
| Sample Type | Recommended Quantity | Collection & Handling |
|---|
| Plasma / Serum | 50–100 μL | EDTA plasma preferred over heparin (heparin interferes with lipid extraction). Separate within 30 min of collection. Snap-freeze at –80°C. Avoid repeated freeze-thaw cycles. |
| Tissue (Brain, Liver, Aorta) | 10–50 mg wet weight | Snap-freeze in liquid nitrogen immediately after dissection. For brain, regional dissection (cortex, hippocampus, cerebellum, white matter) is recommended if region-specific SM profiling is desired. |
| Cultured Cells | 1–5 × 10⁶ cells | Wash twice with ice-cold PBS. Scrape and pellet at 4°C. Snap-freeze pellet. For sphingomyelinase activity studies, include aSMase/nSMase inhibitor-treated controls. |
| Isolated Lipoproteins (LDL, HDL, VLDL) | 100–500 μg protein | Isolate by sequential ultracentrifugation. Dialyze against PBS-EDTA. Store at 4°C and analyze within 48 h or snap-freeze at –80°C. Report protein concentration for normalization. |
| Food Matrices (Milk, Egg, Meat) | 100–500 mg | Homogenize and lyophilize for dry weight normalization. For dairy, liquid milk samples (1–5 mL) are accepted with saponification or Folch extraction as specified. Report fat content where available. |
| Client-Prepared Lipid Extracts | Equivalent to 50–200 μg protein or 10–50 mg tissue | Dry extracts under nitrogen; ship in amber glass vials on dry ice. Provide extraction protocol, internal standard details, and tissue weight or protein content for normalization. |
Frequently Asked Questions About Sphingomyelin Analysis
How many sphingomyelin species can you detect?
We detect 40+ SM molecular species covering acyl chain lengths from C14 to C26 with 0 to 2 double bonds. The major plasma SM species — SM d18:1/16:0, SM d18:1/18:0, SM d18:1/22:0, SM d18:1/24:0, and SM d18:1/24:1 — are quantified in every panel. Tissue-specific species (e.g., myelin-enriched SM d18:1/24:1, LDL-associated SM d18:1/16:0) are reported with acyl chain annotation. The method does not distinguish sphingoid base isoforms (d18:1 vs d18:0) at the MRM level without complementary high-resolution MS. For studies requiring sphingoid base-level resolution, high-resolution confirmation on the Q Exactive HF-X can be added.
What is the SM/ceramide ratio and why is it important?
The SM/ceramide ratio reflects the balance between sphingomyelin synthesis (by SMS1 in Golgi and SMS2 at the plasma membrane) and hydrolysis (by acid and neutral sphingomyelinases). A decreased SM/Cer ratio indicates sphingomyelinase activation — a key event in apoptosis (aSMase), inflammation (nSMase), and membrane microdomain reorganization. We quantify SM and ceramide species from the same sample extract and report both total and species-level SM/Cer ratios. For de novo pathway assessment, we additionally measure dihydroceramide (dhCer) and dihydrosphingomyelin (dhSM) — the dhSM/dhCer ratio distinguishes synthesis from hydrolysis.
What is the detection limit for sphingomyelin quantification?
The lower limit of quantification (LLOQ) is 0.5 ng/mL for SM d18:1/16:0 in solution, using the phosphocholine head-group fragment (m/z 184) in positive-ion MRM mode. Intra-assay precision (CV) is below 8% for major SM species and below 12% for low-abundance species (SM d18:1/14:0, SM d18:1/26:0). Quantification uses deuterated internal standards (SM d18:1/12:0-d9, Cer d18:1/12:0-d7) with 7-point matrix-matched calibration and 1/x2 weighted regression (r2 ≥ 0.995).
Can sphingomyelin be analyzed together with ceramide and other sphingolipids?
Yes. SM, ceramide (Cer), dihydroceramide (dhCer), sphingosine (Sph), and sphingosine-1-phosphate (S1P) are quantified from the same lipid extract in a single analytical run. SM species are detected by MRM of the m/z 184 phosphocholine fragment, while ceramide species use the m/z 264 sphingoid base fragment. This integrated approach provides a complete sphingolipid pathway readout — from SM synthesis through hydrolysis to downstream signaling — without requiring separate sample preparations or additional sample volume.
What sample types do you accept and how should they be prepared?
Plasma/serum (50–100 μL, EDTA preferred), tissue (10–50 mg, snap-frozen in liquid nitrogen), cultured cells (1–5 × 10⁶, washed with ice-cold PBS), isolated lipoproteins (100–500 μg protein), and food matrices (100–500 mg, homogenized). Plasma should be separated within 30 minutes of collection. For sphingomyelinase activity studies, include enzyme inhibitor controls (e.g., desipramine for aSMase, GW4869 for nSMase). Avoid repeated freeze-thaw cycles — sphingolipids are susceptible to enzymatic degradation during thawing.
Can you analyze dietary sphingomyelin in food samples?
Yes. We offer food-grade SM analysis with validated extraction protocols for milk and dairy products, egg yolk, meat, and infant formula. The method includes lipid extraction by modified Folch or direct saponification, depending on matrix complexity, with SM d18:1/12:0-d9 as the internal standard. Results are reported as mg SM per 100 g food weight with species-level composition. Recovery validation for each matrix type is included in the QC report.
How does SM species profiling differ from total sphingomyelin measurement?
Total SM measurement — typically by enzymatic assay or phospholipid phosphorus determination — reports a single aggregate value that masks biologically meaningful shifts in SM acyl chain composition. For example, SM d18:1/16:0 and SM d18:1/24:0 have opposing associations with cardiovascular risk, yet total SM cannot distinguish them. Species-level profiling resolves individual SM molecular species by acyl chain length and unsaturation, revealing tissue-specific remodeling, dietary influences, and disease-associated shifts that are invisible to total SM assays.
Is this service for clinical diagnostic use?
No. This sphingomyelin analysis service is for research use only (RUO). It is not intended for clinical diagnostic procedures, patient management, or treatment decisions. All results, data files, and interpretive reports are provided exclusively for research purposes. Clinical sphingolipid testing — such as acid sphingomyelinase activity assays for Niemann-Pick disease — should be ordered through licensed clinical laboratories.