Targeted Quantification of Lysophospholipids
Absolute quantification of 50+ LPL species using class-specific isotopic internal standards, ensuring high accuracy and reproducibility.

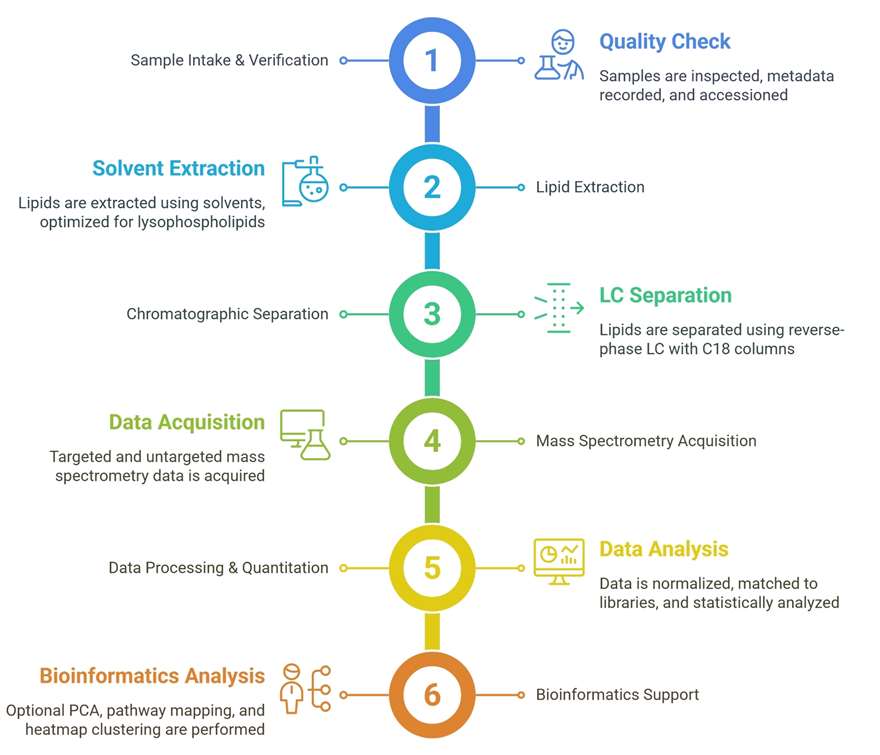
Creative Proteomics offers high-precision lysophospholipid analysis services using advanced LC-MS/MS and Orbitrap platforms to identify, quantify, and interpret 50+ LPL species. Our service helps researchers uncover lipid signaling roles, pathway alterations, and structural isomers across complex biological samples—delivering actionable insights for metabolic, immunological, and lipidomics research.
Submit Your Request Now
×Our services have earned the trust of companies, schools, and organizations globally, and we remain dedicated to maintaining that trust.


Lysophospholipids are monoacyl derivatives of phospholipids, generated primarily via the action of phospholipases or during lipid remodeling processes. As critical bioactive lipids, LPLs are not merely structural components of cell membranes but serve as potent signaling molecules involved in inflammation, cell proliferation, migration, and membrane dynamics. Their roles in energy metabolism, immunity, and lipid transport make them valuable biomarkers and targets in basic research and industrial applications.
Creative Proteomics offers a comprehensive lysophospholipid profiling service that captures this lipid subclass's complexity across diverse sample types, providing researchers with actionable insights.

Targeted Quantification of Lysophospholipids
Absolute quantification of 50+ LPL species using class-specific isotopic internal standards, ensuring high accuracy and reproducibility.

Untargeted LPL Profiling and Novel Compound Discovery
High-resolution, data-dependent acquisition to identify known and unknown lysophospholipid species and their lipid derivatives.

Isomer-Specific Characterization
Separation and analysis of positional and geometric LPL isomers using UHPLC-MS/MS with reference standard validation.

Integrated LPL Metabolomics and Pathway Mapping
Functional interpretation of LPL alterations in the context of lipid metabolic pathways, including phospholipase A2 and autotaxin signaling axes.

Spatial Lipidomics (Optional Add-On)
MALDI-TOF mass spectrometry imaging for localization of LPLs directly in tissue sections, enabling spatial lipid profiling.

Advanced Statistical and Bioinformatics Analysis
Multivariate data analysis (e.g., PCA, clustering, biomarker screening) and pathway annotation with full reporting for publication or downstream research.
| LPL Class | Representative Molecular Species | Related Metabolites | Associated Metabolic Pathways |
|---|---|---|---|
| Lysophosphatidylcholine (LPC) | LPC 16:0, LPC 18:0, LPC 18:1, LPC 20:4, LPC 22:6 | Choline, Glycerophosphocholine (GPC) | Glycerophospholipid metabolism, Inflammatory signaling |
| Lysophosphatidylethanolamine (LPE) | LPE 16:0, LPE 18:1, LPE 20:4, LPE 22:6 | Ethanolamine, Glycerophosphoethanolamine (GPE) | PE remodeling, Endocannabinoid metabolism |
| Lysophosphatidic acid (LPA) | LPA 16:0, LPA 18:1, LPA 20:4 | Monoacylglycerol, Glycerol-3-phosphate | Autotaxin-LPA signaling, Cell motility regulation |
| Lysophosphatidylinositol (LPI) | LPI 16:0, LPI 18:0, LPI 20:4 | Inositol phosphate, DAG | PI cycle, Insulin signaling |
| Lysophosphatidylserine (LPS) | LPS 18:0, LPS 18:1, LPS 20:4 | Serine, Glycerophosphoserine (GPS) | Apoptosis regulation, Immune modulation |
| Lysophosphatidylglycerol (LPG) | LPG 16:0, LPG 18:1, LPG 20:4 | Glycerol, Glycerophosphoglycerol (GPG) | PG biosynthesis, Mitochondrial membrane metabolism |
| Lysophosphatidylinositol 4-phosphate (LPI-4P) | LPI-4P 18:0, LPI-4P 20:4 | Inositol-4-phosphate | Phosphoinositide signaling |
| Plasmalogen-type LPLs | LPC P-16:0, LPE P-18:1 | Vinyl ether lipids | Ether lipid metabolism |
| Other Related Lipid Intermediates | Monoacylglycerols (MAGs), Free fatty acids | Acyl-CoAs, Glycerol | Lipolysis, β-oxidation, Glycerolipid metabolism |
Sciex QTRAP® 6500+ LC-MS/MS: Ultra-sensitive quantification in MRM mode with enhanced linear dynamic range.
Thermo Fisher Orbitrap Exploris 480: High-resolution, accurate-mass detection for untargeted lipidomics workflows.
Agilent 1290 Infinity II LC System: Reliable chromatographic separation with superior peak resolution.
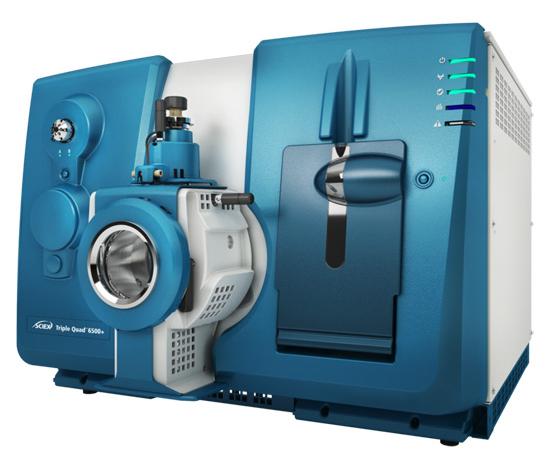
SCIEX Triple Quad™ 6500+ (Figure from Sciex)
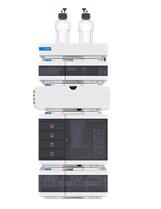
Agilent 1260 Infinity II HPLC (Fig from Agilent)
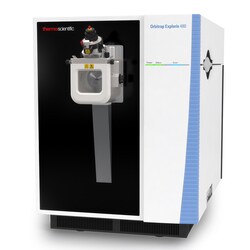
Orbitrap Exploris™ 240 (Figure from Thermo Fisher)
We provide all essential data outputs to ensure transparency, reproducibility, and scientific rigor:
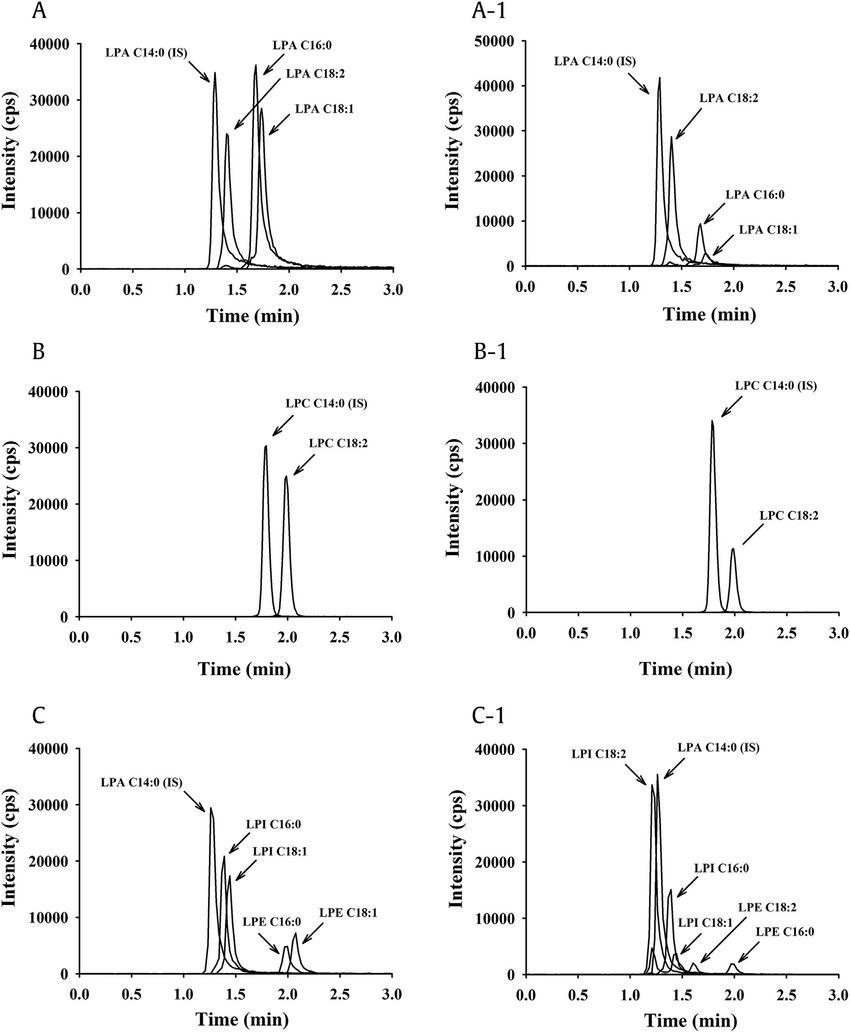
Representative chromatogram of LPLs in GEF using LC-MS/MS (Cho, Hee-Jung, et al., 2019).
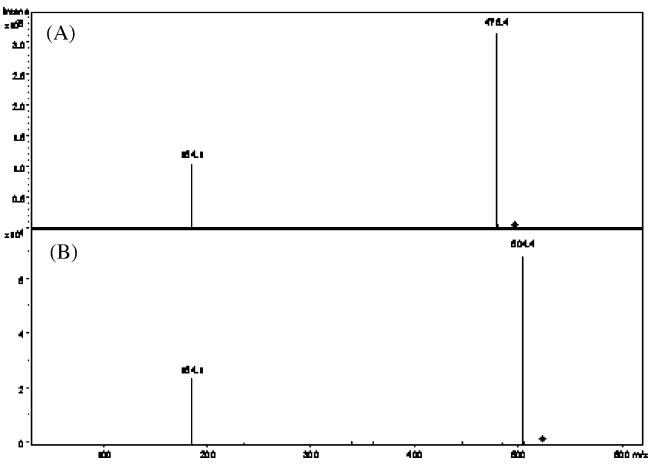
MS/MS spectrum corresponding to (A) LPC-C16:0 (m/z 496.4) and (B) LPC-C18:1 (m/z 522.4) showing the release of water and the phosphocholine moiety (m/z 184.1) (Takahashi, Fumikazu, et al., 2019).
For clients seeking biological interpretation and statistical insight, we offer advanced data analytics upon request:
Explore our Lipidomics Solutions brochure to learn more about our comprehensive lipidomics analysis platform.


Lipid Metabolism Research
Monitor lysophospholipid intermediates in phospholipid remodeling and turnover studies.

Cellular Stress Response
Investigate LPL level changes under oxidative, thermal, or osmotic stress conditions.

Nutrient Supplementation Studies
Evaluate the lipidomic impact of specific dietary components or fatty acid precursors.

Plant Abiotic Stress Physiology
Assess membrane lipid adaptations in plants under drought, salinity, or temperature stress.

Microbial Lipidomics
Profile LPLs in bacterial and fungal systems to study membrane fluidity and adaptation mechanisms.

Environmental Toxicology
Use LPL shifts as indicators of lipid peroxidation and membrane disruption in exposed organisms.
| Sample Type | Required Amount | Storage & Transport Notes |
|---|---|---|
| Plasma / Serum | ≥ 100 μL | Collect using EDTA or heparin tubes; avoid hemolysis. Store at -80°C and ship on dry ice. |
| Cell Pellet | ≥ 1 × 10⁷ cells | Wash with PBS, centrifuge, snap-freeze in liquid nitrogen. Store at -80°C. |
| Animal Tissue | ≥ 50 mg | Freeze immediately after collection. Avoid preservatives. Store at -80°C, ship on dry ice. |
| Cell Culture Medium | ≥ 500 μL | Use serum-free medium if possible. Pre-clear by centrifugation. Store at -80°C. |
| Plant Tissue | ≥ 100 mg (fresh/frozen) | Rinse, blot dry, freeze or freeze-dry. Store at -80°C or in vacuum-sealed bags. |
| Bacterial Biomass | ≥ 5 × 10⁸ cells | Pellet by centrifugation, wash with PBS. Snap-freeze and store at -80°C. |
| Fungal Mycelia | ≥ 100 mg (wet weight) | Harvest, rinse if needed, freeze immediately. Store at -80°C. |
Can I submit freeze-dried samples for analysis?
Yes, freeze-dried samples are acceptable and often preferred for plant and microbial materials. Please ensure samples are sealed and stored under dry, cool conditions prior to shipment.
Is there a recommended protocol for sample collection and storage before submission?
While protocols may vary by sample type, we generally recommend immediate freezing in liquid nitrogen and storage at -80°C. Avoid the use of stabilizers or preservatives unless previously discussed with our team.
What level of biological replication is recommended for statistical analysis?
We recommend a minimum of 3 biological replicates per group to support robust statistical comparisons. More replicates improve confidence, especially in low-abundance LPL detection.
Can you distinguish between LPLs derived from enzymatic vs. non-enzymatic processes?
Our platform quantifies individual LPL species, but distinguishing the origin (e.g., PLA2-mediated vs. oxidation) typically requires contextual interpretation or complementary assays.
How do you control for batch effects during analysis?
We include pooled QC samples, blank runs, and internal standard calibration throughout the batch to monitor and correct for drift or batch-specific variation.
Are there any compounds that may interfere with lysophospholipid detection?
Yes, compounds such as detergents, residual salts, or lipid additives (e.g., BSA, Tween) can interfere with LC-MS signals. Please avoid these in sample prep unless necessary.
What is the typical turnaround time for lysophospholipid analysis?
While timelines depend on project size, most LPL projects are completed within 2–3 weeks after sample receipt. Rush services may be available upon request.
Will my data be comparable across different project batches?
Yes, if internal standards and acquisition parameters are consistent across batches, cross-project comparability is supported. Let us know if cross-study normalization is needed.
What level of detection variation should I expect across replicates?
For well-prepared samples, technical variation (CV%) typically falls below 15% for most LPL species. Biological variation depends on sample heterogeneity and condition.
Can your team assist with integration of LPL data into multi-omics studies?
Absolutely. We support lipidomics integration with transcriptomics, metabolomics, and proteomics datasets through joint interpretation and pathway analysis services.

References
Services:
Online Inquiry
CONTACT US