Our services have earned the trust of companies, schools, and organizations globally, and we remain dedicated to maintaining that trust.
What Is MIPC and Why Measure It?
MIPC is a phosphosphingolipid found predominantly in fungi and yeast, built from a ceramide core linked to an inositol phosphate headgroup and further decorated with a mannose residue. In these organisms, MIPC often sits at a functional intersection between sphingolipid biosynthesis and membrane remodeling, making it a practical readout for:
- Pathway flux and branch behavior (e.g., whether IPC accumulates or converts downstream)
- Membrane adaptation under temperature, osmotic, oxidative, or nutrient perturbations
- Genotype-to-phenotype linking in strain engineering or enzyme perturbation studies
- Bioprocess comparability (batch-to-batch shifts in complex sphingolipid fingerprints)
Crucially, "total MIPC" can hide meaningful biology. Many projects require species-level resolution (chain length, unsaturation, hydroxylation series) to determine which lipid series moves and whether changes match pathway expectations.
MIPC LC–MS/MS Testing Options for Yeast and Fungal Sphingolipids
Core MIPC Panel (Targeted LC–MS/MS)
Best when MIPC is your primary endpoint and you need clear, comparable profiling across groups. Ideal for yeast/fungal biomass and routine condition/strain comparisons.
- MIPC species-focused profiling
- Suitable for time-course and batch comparisons
IPC + MIPC Pathway Panel
Choose this option for pathway questions—whether changes reflect IPC accumulation or conversion toward MIPC. Strong fit for genetic perturbation and pathway engineering studies.
- Interprets IPC → MIPC directionality
- Helps link shifts to biosynthetic logic
Expanded Sphingolipid Context Panel
Use this panel when MIPC alone is not enough and you need broader sphingolipid context to explain membrane remodeling. Helpful for multi-factor designs and strain screening.
- Adds related ceramide/complex pools
- Supports mechanism-focused comparisons
MIPC + M(IP)₂C Extension (On Request)
For projects mapping complex sphingolipid pathway balance beyond MIPC, depending on organism and scope. Best for deeper downstream-branch coverage in one study.
- Extends coverage to M(IP)₂C when applicable
- Feasibility confirmed per organism/matrix
MIPC Species List: What We Can Quantify
MIPC composition depends on organism and growth conditions, so we confirm the final target list per project. Below is the reporting-ready species list structure we can quantify by targeted LC–MS/MS, organized the way most customers analyze MIPC data.
Reportable MIPC species (LC–MS/MS)
| Reporting group | What's included | How it appears in your results |
|---|
| MIPC (species-level) | Individual MIPC molecular species detected in your matrix | MIPC XX:Y;OZ (primary format) and/or MIPC (LCB/acyl) (optional) |
| LCB series (project-defined) | d- vs t-series (and hydroxylation series when applicable) | Species annotated with O count and/or series tags |
| Acyl-chain bins (project-defined) | Chain-length ranges typically driven by organism and pathway state | Grouped totals (e.g., VLCFA-enriched vs shorter-chain) |
| Unsaturation bins (optional) | Saturated vs unsaturated distributions | Grouped totals by double-bond bins |
| MIPC class total | Sum of quantified MIPC species | One-column MIPC Total per sample |
Naming convention: the default species format is total carbon : double bonds ; O (hydroxylation). If your project needs higher structural granularity, we can also provide LCB/acyl-resolved reporting where appropriate.
Representative species list
(Final list is project-confirmed based on organism and matrix.)
| Example MIPC species (format) | Notes (for interpretation) |
|---|
| MIPC 42:0;O2 | Typical series member (example) |
| MIPC 44:0;O2 | Often VLCFA-enriched series (example) |
| MIPC 44:0;O3 | Hydroxylation-shift sensitive (example) |
| MIPC 46:0;O2 | Higher-carbon series (example) |
| MIPC 46:1;O2 | Unsaturation variant (example) |
| MIPC 48:0;O2 | Long-chain series (example) |
| MIPC 48:0;O3 | Hydroxylation variant (example) |
| MIPC 50:0;O2 | Extended series (example) |
| MIPC 50:0;O3 | Extended + hydroxylation (example) |
| MIPC 52:0;O2 | Upper-range example |
How you'll receive it: a complete sample × species matrix (Excel/CSV) plus optional series totals (LCB/chain-length/unsaturation bins) for fast group comparisons.
Why Choose Our MIPC Assay?
- Complex sphingolipid–oriented workflow: designed for IPC/MIPC-class lipids, not a generic lipid panel.
- Targeted LC–MS/MS for consistency: supports reproducible group comparison across batches and conditions.
- Isomer/series awareness: panel design focuses on species series that matter for yeast/fungal membranes.
- Internal-standard anchored quantitation strategy: improves comparability across matrices and extraction variability.
- QC that customers can audit: blanks, pooled QCs, signal stability checks, and flagged outliers are documented.
- Interpretation-ready tables: class totals + species matrix + series summaries (not just peak areas).
- Expandable scope: add IPC (and broader sphingolipids) to connect MIPC changes to pathway logic.
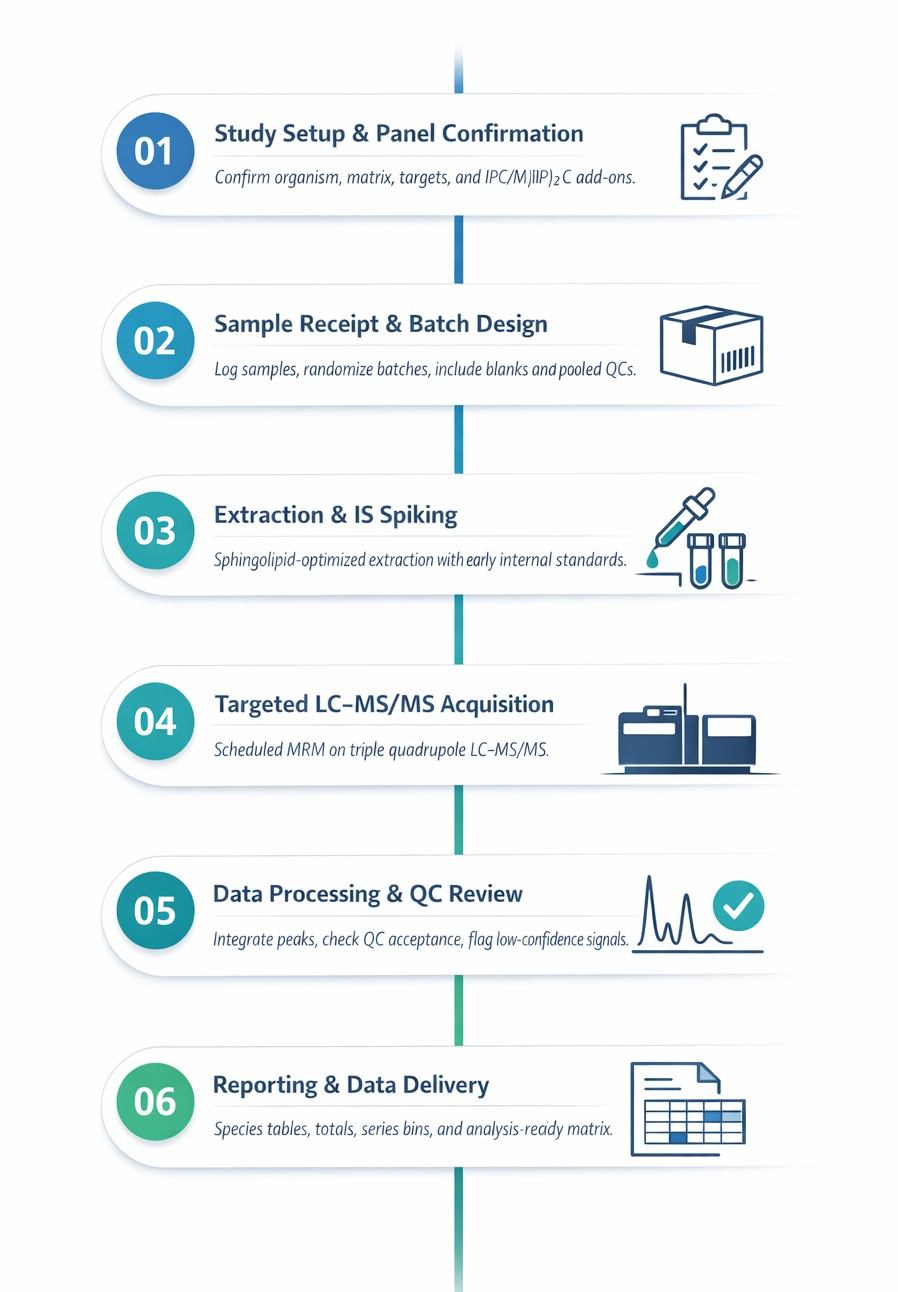
Analysis Workflow for MIPC Profiling
Methods & Instrumentation for MIPC LC–MS/MS Analysis
Platform selection
| What you need | Recommended setup | Typical acquisition | Best fit |
|---|
| Consistent targeted MIPC quantification across groups/batches | UHPLC + Triple quadrupole LC–MS/MS | Scheduled MRM | Routine projects, time courses, strain/condition comparisons |
| Added confidence for annotation or expanded MS/MS evidence (project-dependent) | UHPLC + High-resolution MS (Orbitrap/Q-TOF class) | PRM / full MS/MS | Confirmation, extended characterization, complex matrices |
Method elements we define per project
| Method element | What is controlled for MIPC projects | Notes |
|---|
| LC separation mode | Reversed-phase or HILIC (matrix-dependent) | Selected to support stable peak integration and panel robustness |
| Column format | Narrow-bore UHPLC columns | Project-selected dimensions and chemistry |
| Mobile phase system | Volatile buffers/additives for sphingolipids | Chosen to improve peak shape and ionization stability |
| Ionization | ESI mode tuned to the panel | ESI(+) or ESI(−) finalized during panel confirmation |
| Targeted acquisition | Scheduled MRM with RT control | Cycle time/dwell designed for adequate peak sampling |
| Identity confirmation logic | RT control + transition logic (quantifier/qualifier where applicable) | Applied to reduce ambiguity and improve consistency |
| Batch QC design | Blanks + pooled QCs + randomized run order | Supports comparability and flags instability/outliers |
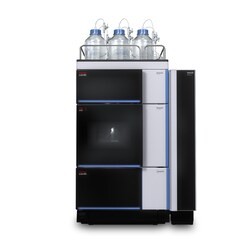
Vanquish UHPLC (Figure from Thermo)
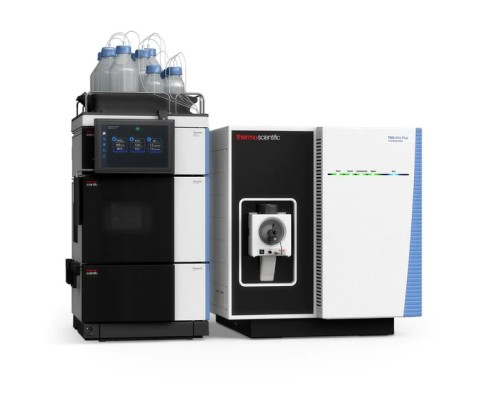
TSQ Altis Triple Quadrupole MS (Figure from Thermo Scientific)
MIPC Profiling: Results and Data Analysis
Clients typically need more than raw peak areas. We organize deliverables so you can compare groups immediately, document QC, and build publication-style figures without reformatting.
Standard Deliverables
- MIPC species table (sample × species): quantitative/relative matrix in consistent naming for statistics and visualization.
- MIPC total per sample: class totals derived from quantified species for fast group comparisons.
- Series summaries (project-defined): compact totals binned by carbon range, saturation, and/or hydroxylation series (as applicable).
- QC summary: blanks, pooled QCs, batch layout notes, and flagged items for auditability and cross-batch confidence.
- Method summary: LC mode, acquisition mode, key settings overview, and reporting rules for documentation.
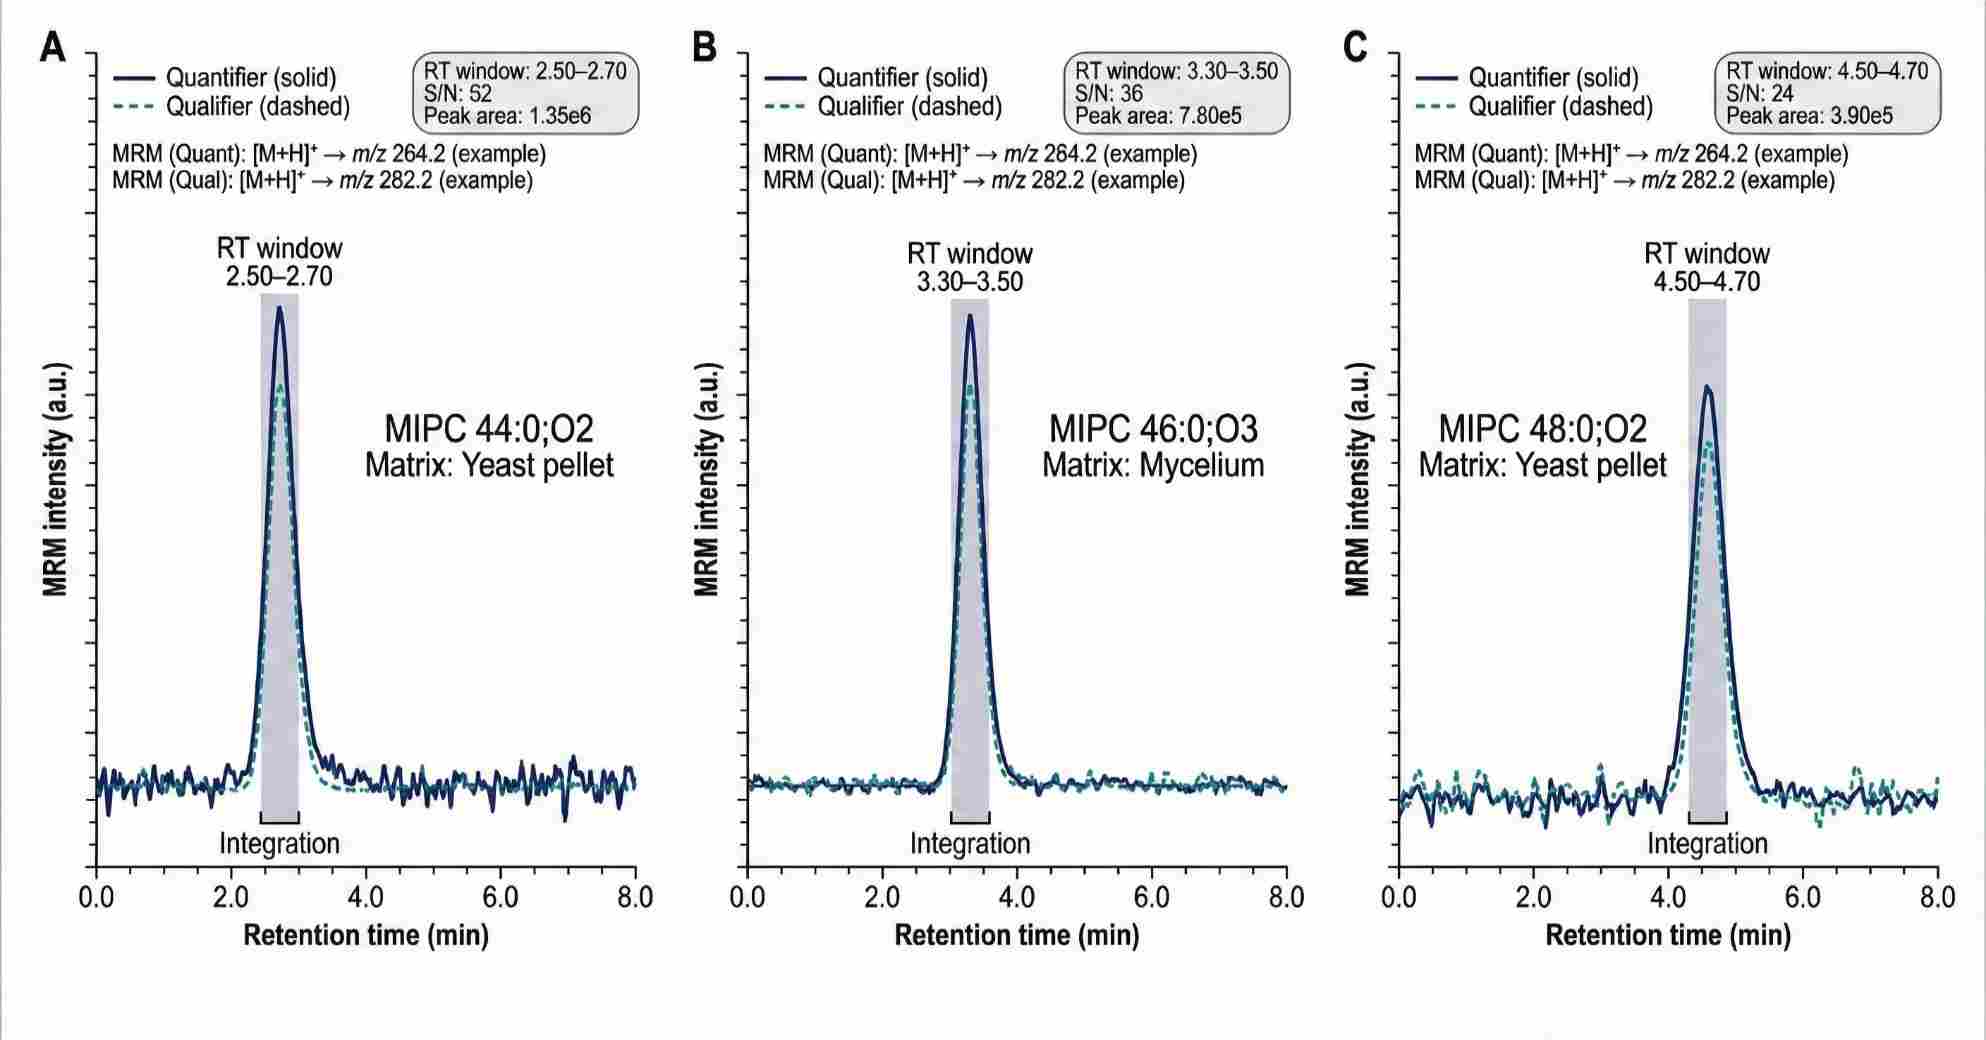
Representative MRM chromatograms of selected MIPC species showing co-eluting quantifier and qualifier transitions, retention-time windows, and integrated peak areas across different sample matrices.
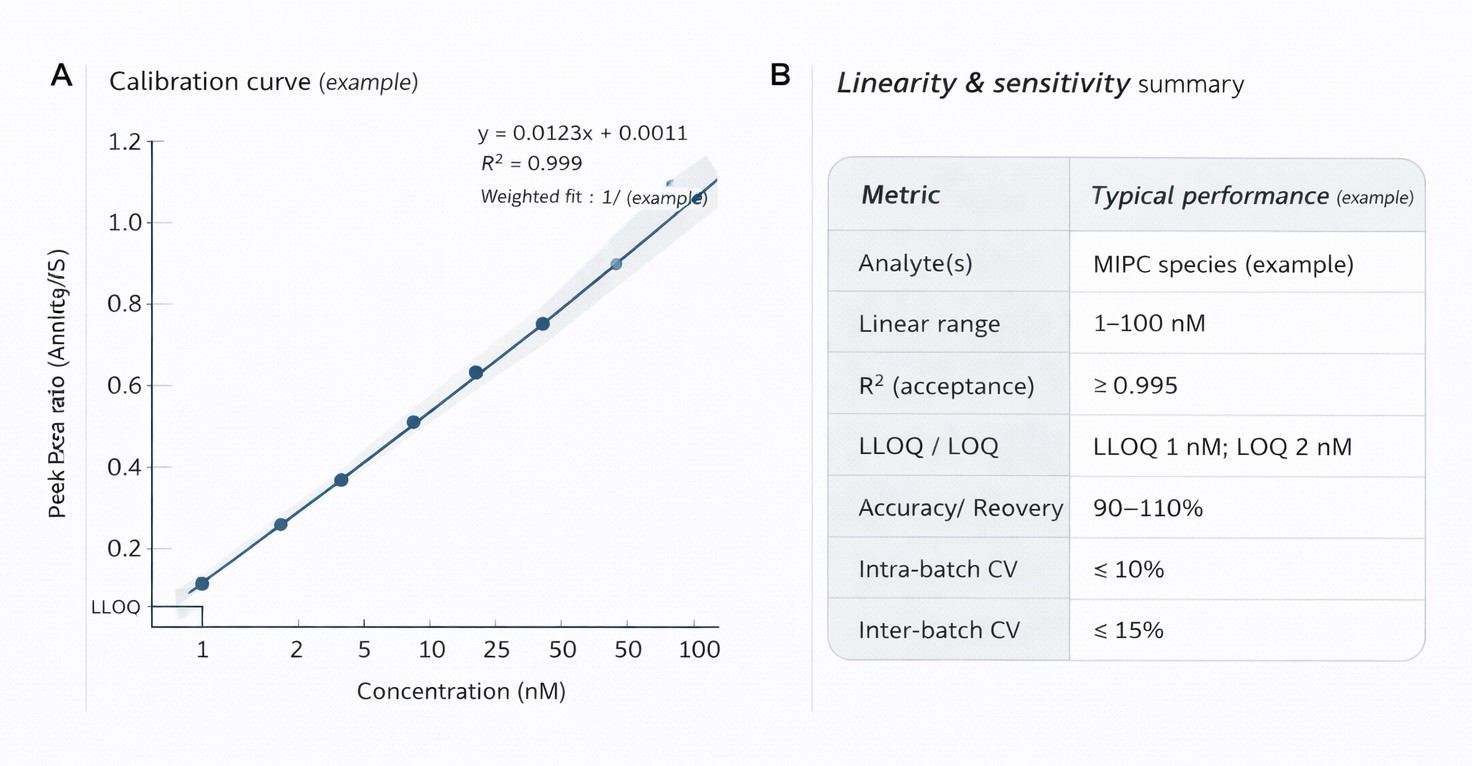
Example calibration curve and performance summary demonstrating linearity, sensitivity, and quantitative robustness of the targeted LC–MS/MS assay for MIPC species.
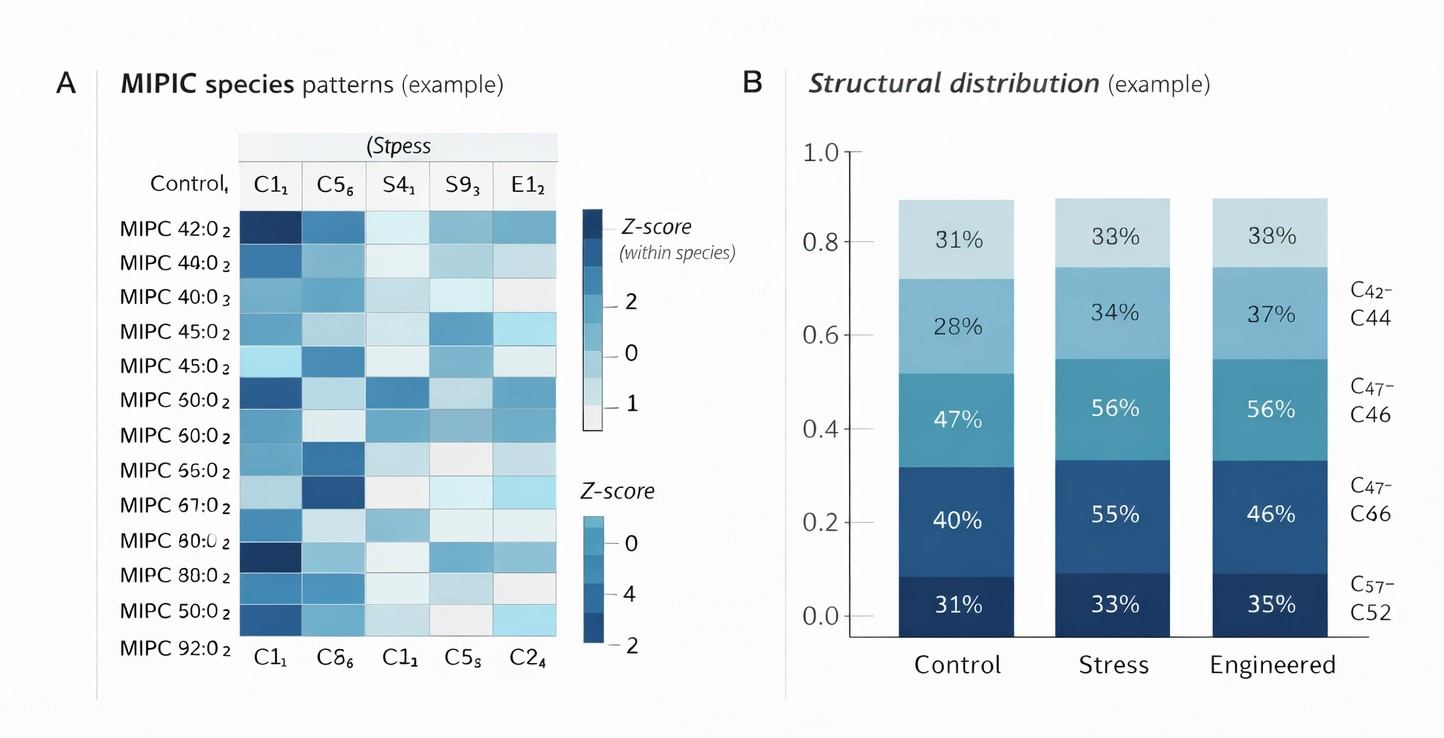
Heatmap of MIPC species abundance across experimental groups combined with structural distribution plots, enabling direct group comparison and pathway-level interpretation.
Advanced Data Analysis (Optional)
- Group comparison visualization pack: heatmap-ready matrices, series distribution plots, and group-level summaries (non-clinical).
- IPC ↔ MIPC pathway interpretation fields: aligned outputs supporting upstream vs downstream shift interpretation (when IPC add-on is included).
- Custom normalization & metadata integration: normalization by biomass/cell count/protein plus integration of batch and condition metadata.
Data Formats
- Excel (.xlsx) and CSV (.csv) result tables
- PDF QC/plots package (when visualization options are included)
- PNG/SVG figure outputs on request
Explore our Lipidomics Solutions brochure to learn more about our comprehensive lipidomics analysis platform.
Download Brochure
Applications of Targeted MIPC Lipidomics
Sphingolipid pathway studies
Quantify MIPC species to assess flux through the IPC → MIPC branch and evaluate pathway responses to genetic or environmental perturbations.
Strain engineering and functional genomics
Compare MIPC profiles across wild-type and engineered strains to understand how gene modifications reshape complex sphingolipid composition.
Membrane remodeling and stress response research
Track changes in MIPC species patterns under osmotic stress, nutrient limitation, temperature shifts, or chemical challenges.
Fungal physiology and cell wall biology
Relate MIPC composition to membrane organization, vesicle trafficking, and growth phenotypes in fungi and yeast.
Comparative lipidomics across conditions or time courses
Perform group-wise comparisons of MIPC totals and structural series to identify condition-dependent lipid remodeling trends.
Integration with multi-omics datasets
Combine MIPC lipidomics with transcriptomics or proteomics data to support pathway-level interpretation and systems biology analyses.
Sample Requirements and Handling for MIPC Analysis
Proper sample handling is critical for reliable MIPC profiling, as complex sphingolipids are sensitive to extraction efficiency and batch variability. The following guidelines are recommended for optimal data quality.
| Sample type | Recommended amount | Handling & storage | Notes |
|---|
| Yeast cell pellet | ≥ 10 mg wet weight (preferred ≥ 20 mg) | Wash with cold PBS, remove supernatant, snap-freeze | Most common matrix for MIPC analysis |
| Fungal mycelium | ≥ 10 mg wet weight | Rinse to remove media, blot dry, snap-freeze | Avoid residual media components |
| Cell culture pellets (fungal) | ≥ 1 × 10⁷ cells | Centrifuge, remove media, snap-freeze | Cell count or biomass normalization recommended |
| Isolated membrane fractions | ≥ 50 µg total protein | Freeze immediately after isolation | Suitable for membrane-focused studies |
| Lyophilized biomass | ≥ 3 mg dry weight | Store dry at −20 °C or −80 °C | Rehydration protocol confirmed per project |
FAQs for MIPC Analysis Service
Why is species-level MIPC profiling more informative than total MIPC quantification?
Total MIPC abundance often masks biologically meaningful changes. In fungi and yeast, membrane properties and stress responses are driven by specific MIPC molecular species, particularly differences in acyl chain length (e.g., C26 vs shorter chains) and hydroxylation state (O2, O3, O4).
Targeted LC–MS/MS resolves these species-level features, allowing you to identify which biosynthetic branch or structural series is altered, rather than observing only a net change.
How does MIPC analysis support fungal sphingolipid pathway mapping?
MIPC is a central intermediate between Inositol Phosphoryl-Ceramide (IPC) and Mannosyl-Diinositol Phosphoryl-Ceramide (M(IP)₂C). Profiling MIPC alone or alongside IPC and M(IP)₂C enables assessment of pathway directionality and potential bottlenecks, supporting studies of gene perturbations and membrane homeostasis.
Can different hydroxylation states of MIPC be distinguished?
Yes. Hydroxylation is a defining feature of fungal sphingolipids. Our targeted method resolves and quantifies MIPC species with different oxygen counts (e.g., distinguishing MIPC 44:0;O2 vs 44:0;O3). This resolution is essential for studying sphingolipid hydroxylases and their roles in cell wall integrity, stress tolerance, and environmental adaptation.
Why use targeted LC–MS/MS (MRM) instead of untargeted lipidomics for MIPC?
MIPC species are structurally similar and often present at relatively low abundance, making reliable annotation challenging in untargeted workflows. Targeted LC–MS/MS using scheduled MRM offers higher sensitivity, consistent quantification across batches, and analysis-ready data outputs without extensive manual peak curation.
How should yeast or fungal samples be prepared to preserve MIPC profiles?
Rapid quenching is critical. We recommend immediate harvesting, cold PBS washing to remove media residues, and snap-freezing in liquid nitrogen followed by storage at −80 °C. For filamentous fungi, blot excess moisture from mycelium before freezing to ensure accurate biomass normalization.
What are the major MIPC species in Saccharomyces cerevisiae?
In S. cerevisiae, dominant MIPC species typically contain a C26 very-long-chain fatty acid and a trihydroxy long-chain base (t18:0), commonly reported as MIPC 44:0;O3 or MIPC 44:0;O2.
Does MIPC analysis require specialized internal standards?
Yes. Because MIPC is specific to fungi and yeast, quantification relies on optimized internal standards, such as non-natural sphingolipid analogs, to correct for extraction efficiency and matrix effects.
Can MIPC profiling be used to study antifungal drug mechanisms?
Yes. Many antifungal compounds target the sphingolipid biosynthetic pathway. MIPC profiling helps determine whether a compound inhibits IPC formation, disrupts mannosylation, or alters downstream complex sphingolipid balance, providing a mechanistic fingerprint.
Can MIPC be analyzed in plant–fungal interaction samples?
Yes, with matrix-specific optimization. Because MIPC is fungal-specific and absent in plants, it can serve as a selective marker of fungal biomass or activity within mixed plant–fungal tissues.