










Cholesteryl Ester Analysis Service

Cholesteryl ester analysis quantifies individual CE molecular species — resolving each ester by its fatty acyl chain rather than reporting total esterified cholesterol as a single value. Using APCI-MRM LC-MS/MS, we detect 12–26 CE species with absolute quantification (LLOQ 0.5 ng/mL, CV<10%). CE fatty acyl composition reveals which enzymes are active (ACAT, LCAT, SOAT), whether lipoproteins are dysfunctional, and whether the CE pool is shifting toward oxidation-prone PUFA species — information invisible to standard lipid panels.

What we analyze: CE molecular species (C14:0–C22:6), CE/free cholesterol ratio, oxidized CE screening (hydroperoxides, epoxides, oxo-CEs), and fatty acyl composition of the CE pool. Compatible with plasma, purified lipoproteins (VLDL/LDL/HDL), tissue, cells, and LNP formulations.

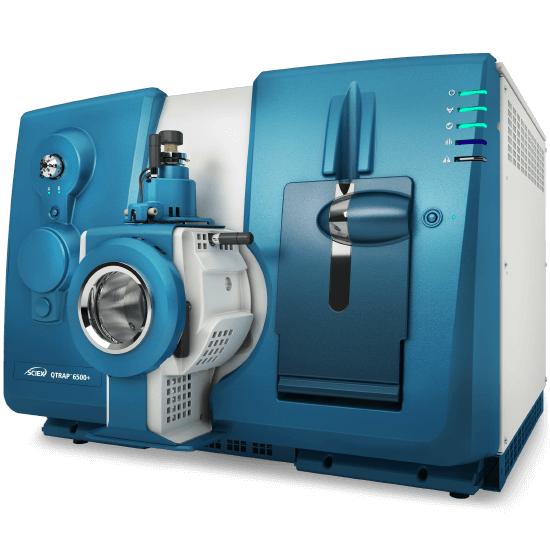
Technology: APCI-MRM on SCIEX Triple Quad 6500+ with cholesteryl cation detection (m/z 369.3) for superior specificity — eliminates interference from co-eluting triacylglycerols and phospholipids that confound ESI-based methods

Applications: Atherosclerosis & foam cell biology, lipoprotein metabolism, NAFLD/MASH & lipid droplet dynamics, LNP formulation QC

Request Analysis

Submit Your Request Now

×

Our services have earned the trust of companies, schools, and organizations globally, and we remain dedicated to maintaining that trust.

Boston University
University at Buffalo
UMass Medical School
Hawaii Pacific University
Medizinische Fakultät
Louisiana State University
Nyulangone
Nature's Fynd
Dietary Supplement Manufacturer
  • Service We Provide
  • Detectable CE Species
  • Advantages
  • Workflow
  • Results and Data Analysis
  • Sample Requirements
  • FAQ

What Are Cholesteryl Esters and Why Analyze Their Species?

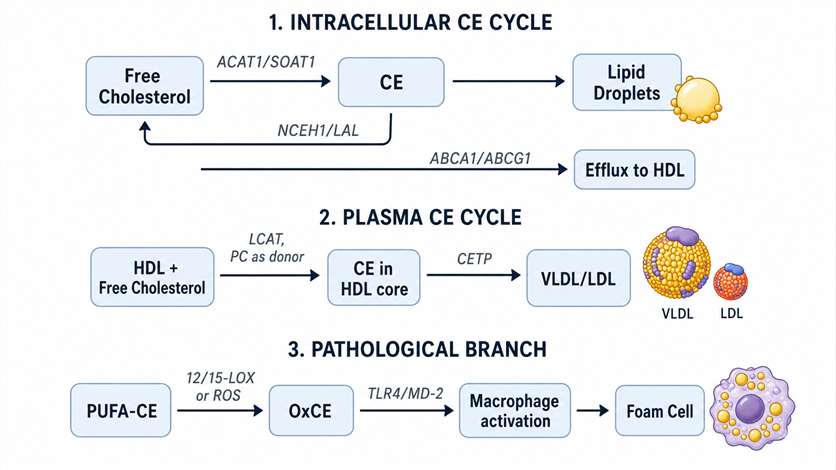
Cholesteryl esters form when cholesterol is esterified with a fatty acid, converting a membrane-active sterol into a hydrophobic lipid stored in lipoprotein cores and lipid droplets. Two enzyme families drive CE biosynthesis: ACAT/SOAT (intracellular) produces CE 18:1 — the hallmark of macrophage foam cells — while LCAT (plasma/HDL) generates CE 18:2 using phosphatidylcholine as the acyl donor. Measuring total esterified cholesterol collapses this into a single number; species-level CE profiling reveals which enzymes are active and whether the CE pool is shifting toward oxidation-prone PUFA species.

CE species profiling reveals:

Cholesteryl Ester Profiling Solutions

From standard species panels to oxidized CE screening — choose the approach that matches your research question.

Targeted CE Species Panel (MRM Quantification)

Absolute quantification of 12 CE species (C14:0–C22:6, expandable to 26+) by APCI-scheduled MRM with deuterated internal standards. Part of our broader sterol lipids analysis platform. All CEs detected via the characteristic cholesteryl cation at m/z 369.3 — eliminating triacylglycerol and phospholipid interference that confounds ESI-based methods. LLOQ 0.5 ng/mL, intra-batch CV ≤10%, R² ≥ 0.995. Includes CE/free cholesterol ratio and fatty acyl composition summary. Ideal for lipoprotein composition, ACAT/LCAT activity assessment, and biomarker panels.

Oxidized CE Screening & Custom Development

Semi-targeted detection of oxidized CE species (hydroperoxides, epoxides, oxo-CEs) by HRAM full-scan MS with confirmatory PRM. Oxidation-controlled workflow (BHT antioxidant, nitrogen atmosphere, amber vials) ensures OxCE data reflect endogenous biology, not ex vivo artifacts. Custom method development for non-standard CEs (odd-chain, very-long-chain, trans-fatty-acid, nitrated adducts), purified lipoprotein fractions, and stable-isotope tracer studies (¹³C/²H-cholesterol incorporation). Method validation: R² ≥ 0.995, recovery 85–115%, CV ≤10%.

Detectable Cholesteryl Ester Species

Our standard targeted panel covers 12 CE molecular species from C14 to C22. Species are resolved by reversed-phase C18 chromatography and quantified by APCI-MRM using the cholesteryl cation (m/z 369.3) as the characteristic fragment ion.

CE SpeciesFatty AcylPrimary SourceBiological SignificanceTypical Plasma Level (nmol/mL)
CE 14:0Myristic (14:0)Dietary, de novo lipogenesisMinor species; elevated in metabolic syndrome5–15
CE 16:0Palmitic (16:0)ACAT1/2, de novo lipogenesisSecond most abundant CE; elevated saturated CE reflects ACAT substrate preference shift150–250
CE 16:1Palmitoleic (16:1)SCD1 product, ACAT2ACAT2-CE biomarker; 6.5% increased CAD odds per 10 μmol/L increment30–60
CE 18:0Stearic (18:0)Dietary, ACAT1Minor species; elevated in phospholipidosis10–25
CE 18:1Oleic (18:1)ACAT1 (major product)Dominant intracellular CE; foam cell marker; ACAT1 activity surrogate300–450
CE 18:2Linoleic (18:2)LCAT (major product)Most abundant plasma CE; HDL maturation marker; primary OxCE precursor — ~23% oxidized in plaques600–800
CE 18:3α-Linolenic (18:3)Dietary, LCATOxidation substrate; plant-derived fatty acid marker15–40
CE 20:3Dihomo-γ-linolenic (20:3)Elongation of 18:2Eicosanoid precursor reservoir; elevated in inflammatory states10–30
CE 20:4Arachidonic (20:4)Dietary, LCATKey OxCE substrate — ~16% oxidized in plaques; eicosanoid precursor; pro-inflammatory when oxidized60–100
CE 20:5EPA (20:5)Dietary (fish oil)ω-3 PUFA marker; anti-inflammatory; competes with CE 20:4 for oxidation10–40
CE 22:5DPA (22:5 n-3)Dietary, elongation of EPAω-3 status marker; elevated with fish oil supplementation5–20
CE 22:6DHA (22:6)Dietary, LCATBrain/retina-enriched CE; ~12% oxidized in plaques; neural membrane cholesterol reservoir25–60

Custom expansion available: Odd-chain CEs (CE 15:0, 17:0 — ideal as endogenous reference species absent from mammalian systems), very-long-chain CEs (CE 24:0, 24:1), trans-fatty-acid CEs, and oxidized CE species (CE 18:2 +O, CE 18:2 +2O, CE 20:4 +O, CE 20:4 +2O, 9-HODE cholesteryl ester, 9-oxononanoate CE).

Why Choose Our CE Analysis Platform

  • APCI-MRM specificity: Cholesteryl cation detection (m/z 369.3) eliminates triacylglycerol and phospholipid interference — a known ESI limitation — enabling reliable quantification of low-abundance PUFA-CEs down to 0.5 ng/mL.
  • Absolute quantification: Deuterated CE internal standards (CE 17:0-d₃, CE 18:1-d₇) in every sample. External calibration R² ≥ 0.995. CE/free cholesterol ratio reported per sample.
  • Species-level resolution: Quantify individual CE molecular species — not total esterified cholesterol. Distinguish ACAT-derived CE 18:1 from LCAT-derived CE 18:2. Track PUFA-CE oxidation substrates independently from saturated storage CEs.
  • Oxidation-controlled workflow: Nitrogen-atmosphere extraction with BHT (50 μM), amber vial handling under argon, and batch QC of OxCE/CE ratio — ensuring OxCE data reflect biology, not sample handling artifacts.
  • Oxidized CE screening: Semi-targeted HRAM with confirmatory PRM detects hydroperoxide, epoxide, and oxo-CE species invisible to standard MRM panels — the only service combining targeted CE quantification with oxidative modification screening.
  • Lipoprotein-ready: Validated workflows for purified VLDL, LDL, and HDL fractions. CE composition normalized to apoB-100 particle number for lipoprotein quality assessment beyond conventional cholesterol measurements.

Cholesteryl Ester Analysis Workflow

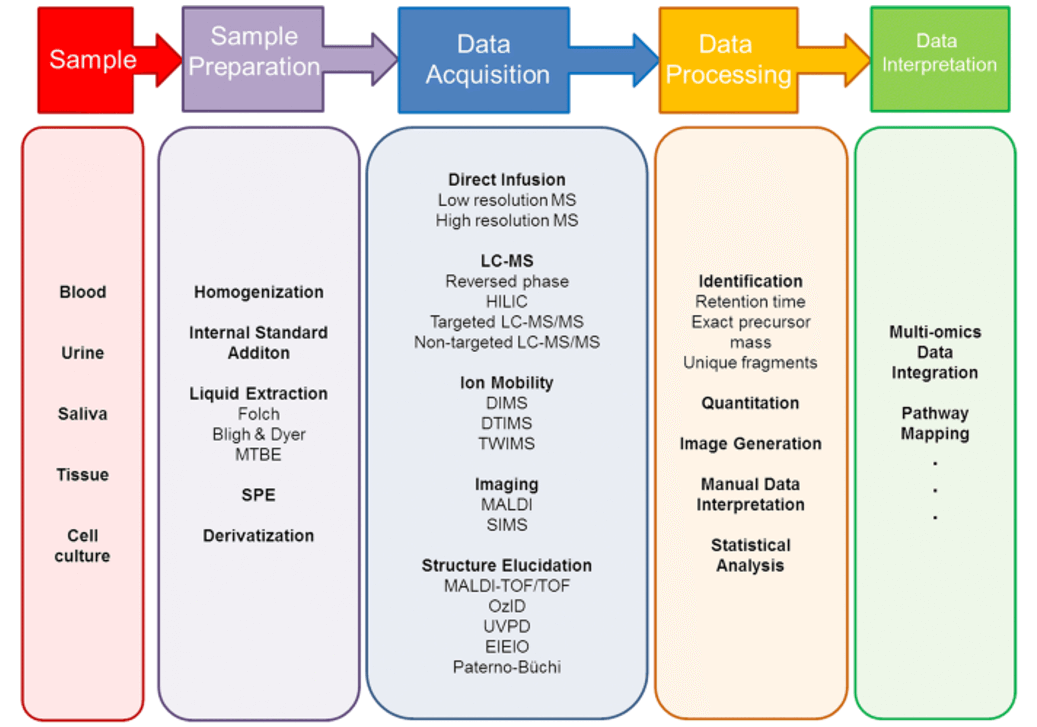
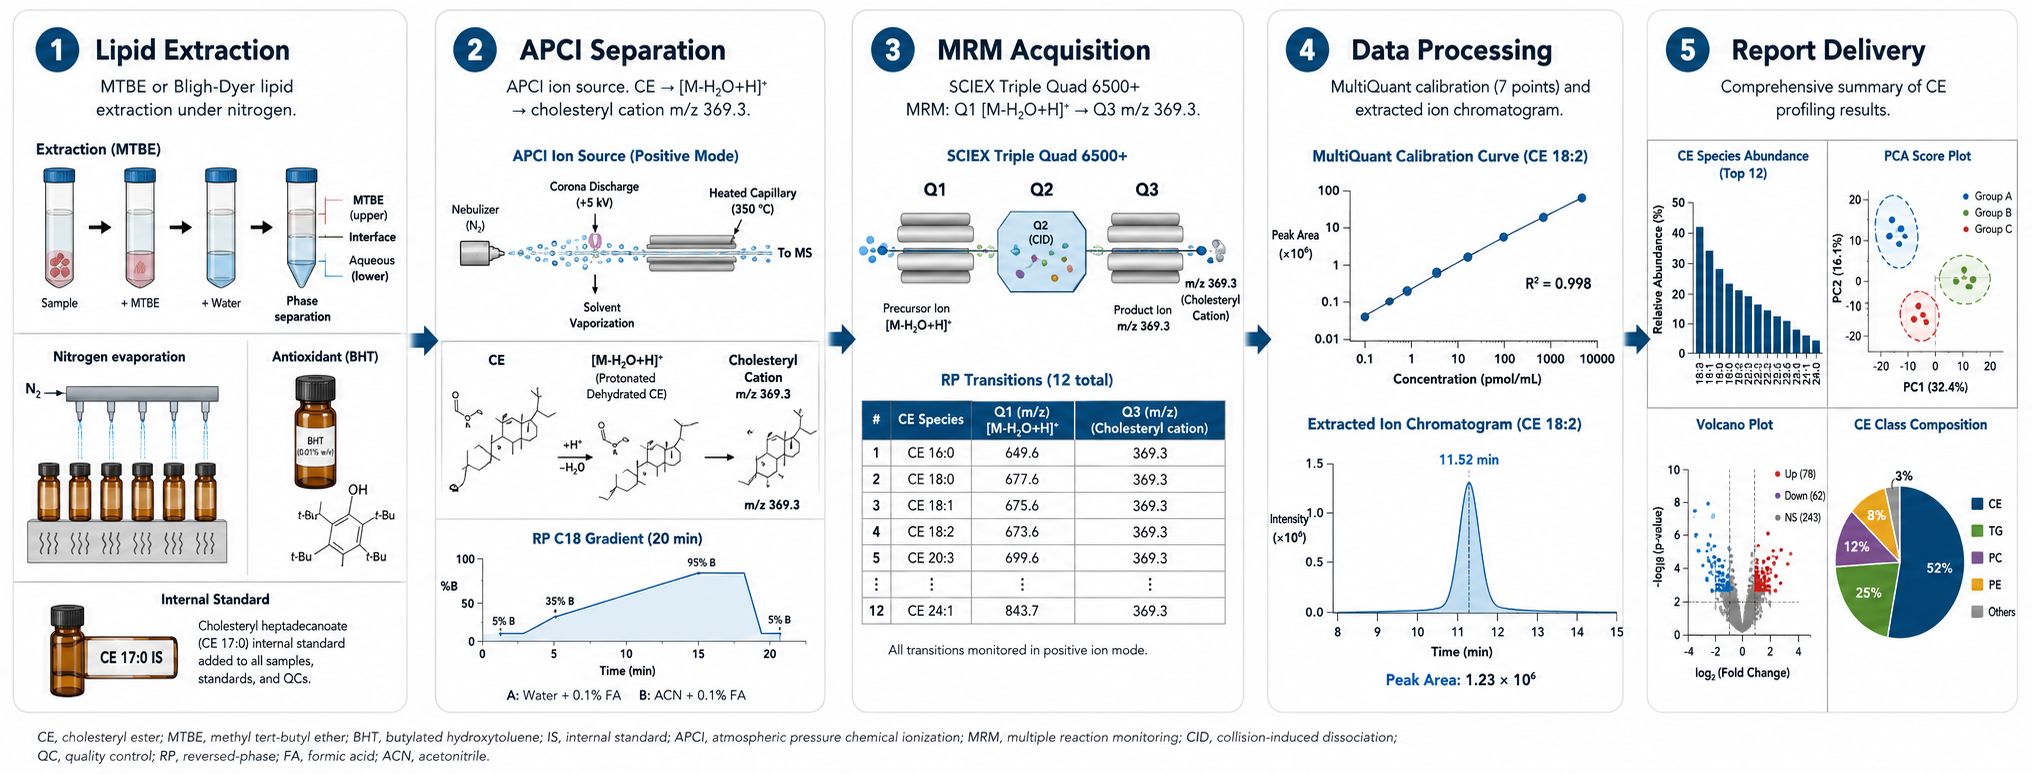
Cholesteryl ester analysis workflow: extraction → APCI separation → MRM acquisition → data processing → report delivery

Technology Platform for CE Analysis

SCIEX Triple Quad 6500+

SCIEX Triple Quad 6500+ with APCI Source — Atmospheric pressure chemical ionization generates the characteristic cholesteryl cation [M-H₂O+H]⁺ → m/z 369.3 via in-source dehydration from all CE species regardless of fatty acyl chain. Scheduled MRM acquisition with polarity switching enables simultaneous detection of co-eluting triacylglycerols and phospholipids in the same run. Deuterated internal standards (CE 17:0-d₃, CE 18:1-d₇) for isotope-dilution quantification.

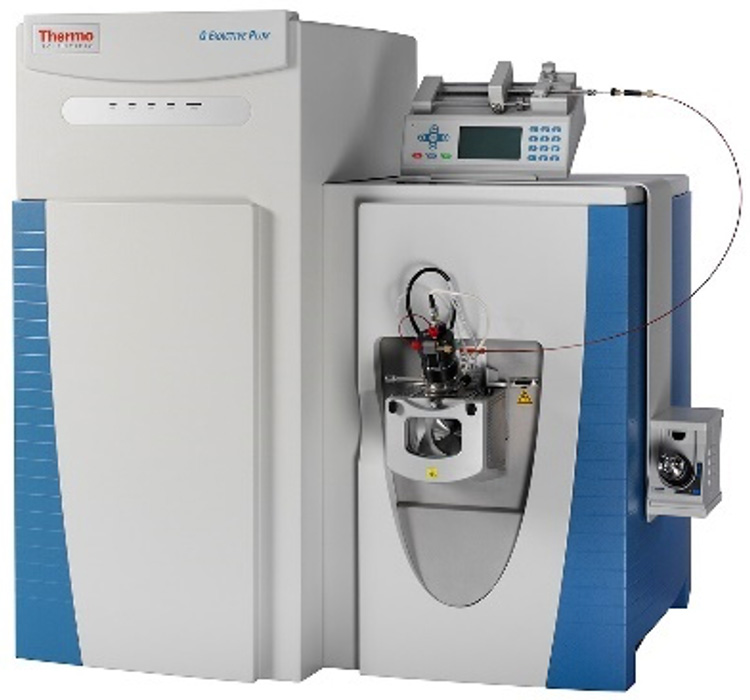
Thermo Q Exactive HF-X

Thermo Q Exactive HF-X Orbitrap — High-resolution (120,000 at m/z 200) full-scan acquisition for oxidized CE screening. Data-dependent MS2 (Top 10) or targeted PRM for structural confirmation of OxCE species. Mass accuracy<3 ppm with HCD fragmentation for characterization of fatty acyl oxidation position and modification type.

LC-APCI-MS/MS Method Specifications

ParameterSpecification
ChromatographyReversed-phase C18 (2.1 × 100 mm, 1.7 μm); 20-min gradient (85–100% B); 40°C column temperature; mobile phase A: methanol/water (85:15) + 5 mM ammonium acetate; B: isopropanol + 5 mM ammonium acetate
IonizationAPCI (+) with corona discharge needle (4 μA); vaporizer temperature 400°C; nebulizer gas 40 psi; auxiliary gas 30 psi; sheath gas 50 psi
MRM AcquisitionScheduled MRM, 30-s detection windows; dwell time ≥20 ms; 2 transitions per CE species (quantifier: [M-H₂O+H]⁺ → m/z 369.3; qualifier: [M-H₂O+H]⁺ → fatty acyl-specific fragment)
LLOQ0.5 ng/mL (abundant mono/di-unsaturated CEs); 2 ng/mL (saturated CEs); ≤10 ng/mL (low-abundance PUFA-CEs); S/N ≥ 10:1
PrecisionIntra-batch CV ≤10%; inter-batch CV ≤15%; pooled QC every 10 injections; >90% feature fill across batches
Dynamic Range≥4 orders of magnitude; linearity R² ≥ 0.995 (7–9 point calibration)
Carryover<0.1% via needle wash (isopropanol) and divert valve
Oxidation ControlCold MTBE extraction (4°C) with BHT (50 μM); amber vials under argon; OxCE/CE drift<15% in batch QC

Results and Data Analysis

CE Profiling Report

Quantitative results:

  • Species-level CE abundance table (nmol/mL or nmol/mg protein)
  • CE/free cholesterol ratio per sample — direct readout of cholesterol esterification capacity
  • CE fatty acyl composition summary: saturated, monounsaturated, and polyunsaturated CE distribution
  • ACAT1/LCAT product ratio (CE 18:1 / CE 18:2) — surrogate for intracellular vs. plasma esterification activity

Statistical analysis:

  • Principal component analysis (PCA) with 95% confidence ellipses
  • Hierarchical clustering heatmap of CE species across groups
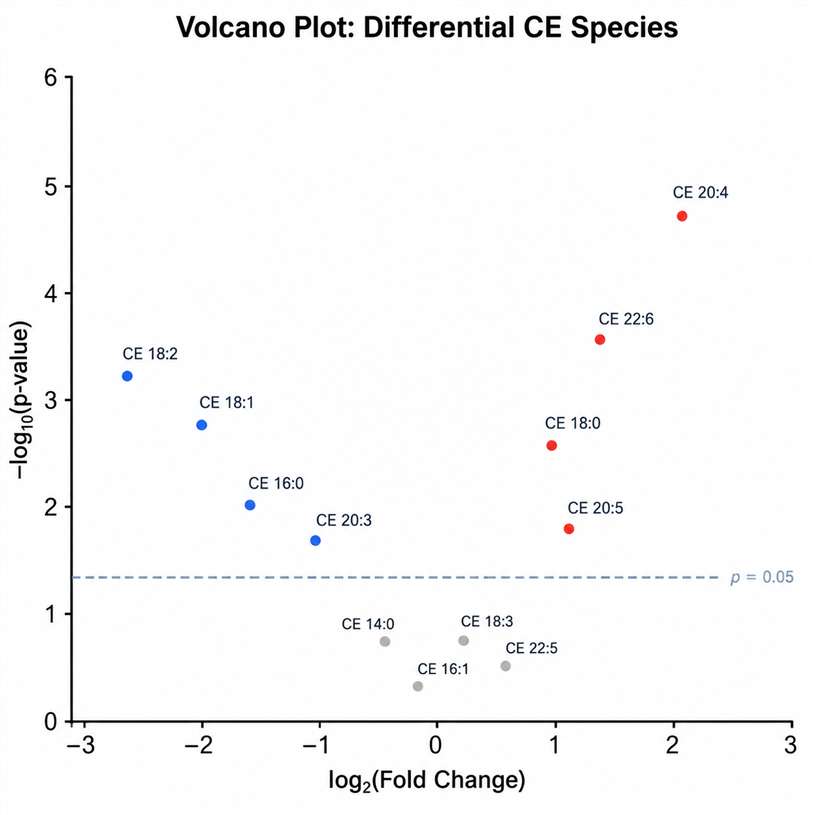
  • Volcano plot (fold change vs. p-value) for pairwise comparisons
  • Group-wise comparisons with Student's t-test or ANOVA, Benjamini-Hochberg FDR correction
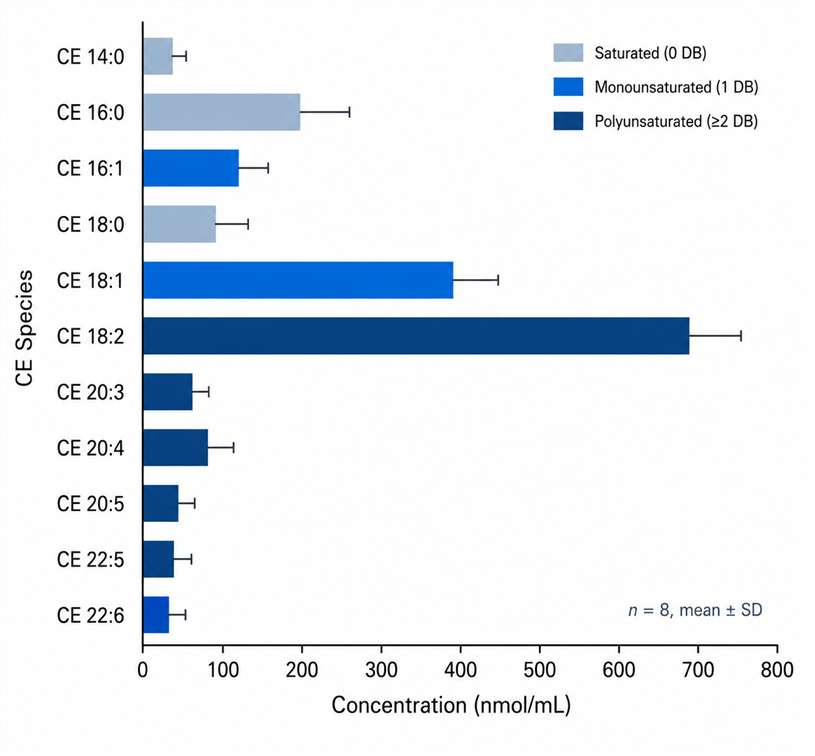
CE species abundance profile across 12 molecular species

CE species abundance: CE 18:2 dominates plasma, reflecting LCAT activity on HDL.

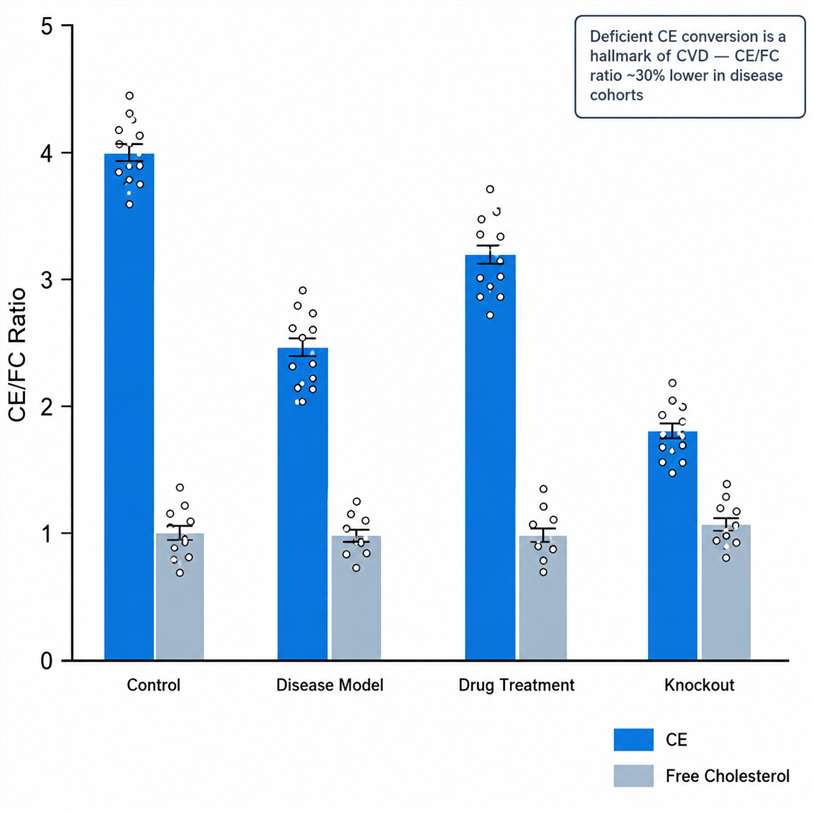
CE/Free Cholesterol ratio across experimental groups

CE/FC ratio: deficient esterification is a hallmark of cardiovascular disease.

Volcano plot of differential CE species abundance

Volcano plot: significantly altered CE species between experimental groups.

Data Deliverables

  • Excel workbook — CE species data with mean, SD, CV, fold change, and adjusted p-values
  • PDF report — publication-ready figures with statistical summary
  • Raw data package — MRM chromatograms, MS/MS spectra, integration boundaries (.wiff or .mzML)
  • Methodology document — complete extraction and LC-MS protocol for manuscript methods section
  • QC report card — internal standard recovery, pooled QC CV distribution, carryover check

Optional Advanced Analysis

  • Oxidized CE screening report — semi-targeted OxCE detection with HRAM data and PRM confirmation spectra
  • Lipoprotein CE composition analysis — CE species normalized to apoB-100 for VLDL/LDL particle quality assessment
  • Stable-isotope tracer analysis — ¹³C/²H-cholesterol incorporation into CE species for ACAT/LCAT flux measurement
  • Pathway mapping — CE data integrated with cholesterol metabolism and oxylipin pathways (KEGG, Reactome)

Cholesteryl ester biosynthesis, metabolism, and oxidation pathwayCholesteryl Ester Metabolism: Intracellular CE cycle (ACAT1/SOAT1 → lipid droplets → NCEH1/LAL → efflux), plasma CE cycle (LCAT on HDL → CETP transfer to VLDL/LDL), and oxidative pathway (PUFA-CE → 12/15-LOX/ROS → OxCE → TLR4/MD-2 → foam cell)


Learn more about our targeted lipidomics platform and cholesteryl ester analysis capabilities. Download the complete service brochure for method details, validation data, and application examples.

Download Brochure

Applications of Cholesteryl Ester Profiling

Atherosclerosis & Foam Cell Biology

Quantify CE accumulation in macrophage foam cells and track PUFA-CE oxidation into pro-inflammatory OxCE species that activate TLR4/MD-2, driving foam cell formation. Monitor CE 18:1 as an ACAT1 activity readout and CE/FC ratio as an esterification efficiency marker.

Lipoprotein Metabolism & CETP/LCAT Function

Profile CE species in purified VLDL, LDL, and HDL fractions. CE 18:2/18:1 ratio distinguishes LCAT-derived from ACAT-derived esters. Normalize CE to apoB-100 for particle-level lipoprotein quality assessment. Track CETP-mediated CE/TAG exchange between HDL and apoB-containing lipoproteins.

NAFLD/MASH & Lipid Droplet Dynamics

Quantify hepatic CE shifts during NAFLD-to-MASH progression. SOAT1-dependent CE accumulation drives cholesterol crystal formation in hepatocyte lipid droplets — a key pathogenic event. Monitor CE saturation index as a lipotoxicity marker and assess SOAT inhibitor efficacy through species-level profiling.

LNP Formulation & Cholesterol Ester QC

CE species are increasingly used as cholesterol replacements in LNP formulations. Quantify CE composition, monitor hydrolysis during storage, and correlate CE species with encapsulation efficiency. APCI-MRM specificity distinguishes CE from co-formulated phospholipids and ionizable lipids.

Sample Requirements for CE Analysis

Sample TypeRecommended MinimumCollection & Handling
Plasma / Serum≥50 μLEDTA-K₂ tubes (avoid heparin). Centrifuge within 2 h at 4°C. Store at –80°C. ≤2 freeze-thaw cycles.
Purified Lipoproteins (VLDL/LDL/HDL)≥20 μg proteinIsolate by ultracentrifugation or FPLC. Determine protein by BCA. Snap-freeze in liquid nitrogen, store at –80°C.
Cultured Cells / Foam Cells≥5 × 10⁶ cellsWash 2× with ice-cold PBS. Pellet at 4°C. Snap-freeze. Include ≥3 biological replicates.
Animal Tissue (Liver, Aorta, Adrenal, Brain)10–50 mg wet weightPerfuse with ice-cold PBS. Snap-freeze in liquid nitrogen. For OxCE analysis, add BHT (50 μM) to homogenization buffer.
LNP / mRNA Formulations≥50 μL formulationShip on dry ice in amber vials. Include blank formulation and empty LNP controls for normalization.
Client-Prepared Lipid ExtractsEquivalent to above amountsMTBE or Bligh-Dyer extraction under nitrogen with BHT. Dry under argon. Ship in amber vials on dry ice. Provide extraction protocol.

Frequently Asked Questions About CE Analysis

What cholesteryl ester species can you detect?

Our standard targeted panel covers 12 CE species: CE 14:0, 16:0, 16:1, 18:0, 18:1, 18:2, 18:3, 20:3, 20:4, 20:5, 22:5, and 22:6. Custom panels expand to 26+ species — including odd-chain (CE 15:0, 17:0), very-long-chain (CE 24:0, 24:1), and trans-fatty-acid CEs. Oxidized CE screening covers hydroperoxides, epoxides, and oxo-derivatives of major PUFA-CEs. See the Detectable CE Species table above for biological context and typical plasma levels for each species.

How does CE species profiling differ from measuring total cholesterol?

Standard panels report total esterified cholesterol as one number. Species-level CE profiling resolves each CE by its fatty acyl chain — revealing which enzymes are active and whether the CE pool is shifting toward oxidation-prone PUFA species. For example: CE 18:2 (dominant LCAT product on HDL) vs. CE 18:1 (ACAT1 product in macrophages) — a declining 18:2/18:1 ratio signals a shift from plasma to intracellular esterification. A low CE/free cholesterol ratio is a hallmark of cardiovascular disease, detectable at the species level even when total cholesterol appears normal.

Why do you use APCI instead of ESI for CE analysis?

APCI (atmospheric pressure chemical ionization) generates the characteristic cholesteryl cation fragment at m/z 369.3 from all CE species regardless of fatty acyl chain. This single dominant fragment enables highly specific MRM detection that eliminates interference from co-eluting triacylglycerols and phospholipids — a known problem with ESI-based methods where these abundant lipids can suppress or obscure CE signals. The practical benefit: reliable quantification of low-abundance PUFA-CEs (LLOQ ≤10 ng/mL for CE 20:4 and CE 22:6) that would otherwise be difficult to detect in complex plasma or tissue lipid extracts.

Can you detect oxidized cholesteryl esters (OxCE)?

Yes. We offer two tiers: (1) semi-targeted screening using HRAM full-scan MS to detect known OxCE species — hydroperoxides, epoxides, and oxo-derivatives — based on accurate mass and retention time; (2) confirmatory PRM on identified candidates for higher quantitative confidence. Our oxidation-controlled workflow (BHT antioxidant, nitrogen atmosphere, amber vials) is specifically validated for OxCE analysis to ensure detected species reflect endogenous biology, not ex vivo oxidation artifacts.

What is the ACAT1/LCAT product ratio and why does it matter?

CE 18:1/18:2 ratio distinguishes ACAT1/SOAT (intracellular) from LCAT (plasma/HDL) esterification. ACAT1 uses oleoyl-CoA → CE 18:1 (foam cell marker). LCAT uses PC sn-2 acyl → CE 18:2 (HDL maturation marker). An elevated ratio signals intracellular esterification — characteristic of foam cell formation. A declining ratio may reflect impaired LCAT or enhanced CETP transfer. This ratio provides functional enzyme readout without requiring direct enzyme assays.

What do I receive in the final data package?

  • Excel workbook — species-level CE data with mean, SD, CV, fold change, and adjusted p-values
  • PDF report — publication-ready figures with statistical summary
  • Raw data package — MRM chromatograms (.wiff or .mzML), MS/MS spectra, integration boundaries
  • Methodology document — complete extraction and LC-MS protocol for manuscript methods section
  • QC report card — internal standard recoveries, pooled QC CV distribution, carryover check

All data for independent verification and publication — no need to request additional raw files.

* Our services can only be used for research purposes and Not for clinical use.

Services:

Resource:

Platform:


Online Inquiry

CONTACT US

Copyright © 2026 Creative Proteomics. All rights reserved.