Comprehensive Fatty Acid Profiling
Quantitative and qualitative analysis of saturated, monounsaturated, and polyunsaturated fatty acids across C10–C26 chain lengths.
Our services have earned the trust of companies, schools, and organizations globally, and we remain dedicated to maintaining that trust.
Fatty Acid Methyl Esters (FAMEs) are methylated derivatives of fatty acids formed through transesterification of triglycerides or phospholipids with methanol. They serve as essential indicators for lipid metabolism, membrane composition, and energy storage dynamics across biological systems. FAME profiling has become a cornerstone analytical method for assessing lipid functionality in food sciences, microbial classification, algal biofuel development, and agricultural biotechnology.
FAME analysis provides a powerful analytical platform to:

Comprehensive Fatty Acid Profiling
Quantitative and qualitative analysis of saturated, monounsaturated, and polyunsaturated fatty acids across C10–C26 chain lengths.

Targeted FAME Quantification
Absolute quantification of specific fatty acid methyl esters using certified internal standards (e.g., C16:0, C18:1n-9, C20:4n-6).

ω-3 and ω-6 Fatty Acid Analysis
Detailed profiling of essential fatty acids such as EPA, DHA, ALA, and ARA with relevance to nutritional and metabolic studies.

Branched-Chain and Odd-Carbon FAME Identification
Identification of microbial signature fatty acids including iso, anteiso, and odd-carbon chains.

Trans Fatty Acid Characterization
Detection and quantification of industrial and naturally occurring trans fatty acids (e.g., elaidic acid, trans-vaccenic acid).

Lipid Class-Specific FAME Analysis
Separation of lipid fractions (e.g., phospholipids, triglycerides) prior to methylation for class-specific fatty acid distribution.

FAME Fingerprinting for Microbial or Botanical Classification
Chemotaxonomic identification based on fatty acid biomarker patterns, suitable for microbial ecology or plant origin studies.

Comparative FAME Profiling Across Samples
Statistical analysis and visualization of FAME variation between experimental conditions, treatment groups, or time points.

FAME Pathway Integration
Integration of FAME data with known metabolic pathways using KEGG, LipidMaps, and HMDB databases.
| Compound Name | Abbreviation | Carbon Chain | Typical Origin / Function |
|---|---|---|---|
| Methyl caproate | C6:0 | C6 | Medium-chain triglyceride (MCT); energy metabolism |
| Methyl caprylate | C8:0 | C8 | Coconut oil; antimicrobial properties |
| Methyl caprate | C10:0 | C10 | Goat milk; energy metabolism |
| Methyl laurate | C12:0 | C12 | Palm kernel oil |
| Methyl myristate | C14:0 | C14 | Butterfat; membrane structure |
| Methyl pentadecanoate | C15:0 | C15 | Dairy marker; odd-chain biomarker |
| Methyl palmitate | C16:0 | C16 | Common FA in animals and plants |
| Methyl margarate | C17:0 | C17 | Dairy and bacterial marker |
| Methyl stearate | C18:0 | C18 | Animal fats; membrane function |
| Methyl arachidate | C20:0 | C20 | Peanut oil |
| Methyl heneicosanoate | C21:0 | C21 | Experimental lipidomics |
| Methyl behenate | C22:0 | C22 | Rapeseed oil |
| Methyl lignocerate | C24:0 | C24 | Myelin sheath; sphingolipids |
| Methyl hexacosanoate | C26:0 | C26 | Nervous system; peroxisomal disorders |
| Methyl octacosanoate | C28:0 | C28 | Plant waxes |
| Methyl triacontanoate | C30:0 | C30 | Industrial waxes |
| Compound Name | Abbreviation | Carbon Chain | Typical Origin / Function |
|---|---|---|---|
| Methyl palmitoleate | C16:1n-7 | C16 | Mammalian tissue lipid |
| Methyl sapienate | C16:1n-10 | C16 | Human skin lipid |
| Methyl oleate | C18:1n-9 | C18 | Olive oil; common MUFA |
| Methyl vaccenate (cis) | C18:1n-7 | C18 | Ruminant milk fats |
| Methyl elaidate (trans) | C18:1n-9t | C18 | Trans fat; industrial processing |
| Methyl gondoate | C20:1n-9 | C20 | Plant oils |
| Methyl erucate | C22:1n-9 | C22 | Mustard, rapeseed |
| Methyl cetoleate | C22:1n-11 | C22 | Marine fish oils |
| Methyl nervonate | C24:1n-9 | C24 | Nervous tissue lipid |
| Methyl 10-heptadecenoate | C17:1 | C17 | Microbial lipid marker |
| Methyl 10-nonadecenoate | C19:1 | C19 | Bacterial lipid |
| Compound Name | Abbreviation | Carbon Chain | Omega Family | Biological Role |
|---|---|---|---|---|
| Methyl linoleate | C18:2n-6 | C18 | ω-6 | Essential FA; inflammation |
| Methyl α-linolenate | C18:3n-3 | C18 | ω-3 | Precursor to EPA/DHA |
| Methyl γ-linolenate | C18:3n-6 | C18 | ω-6 | Skin health; inflammation |
| Methyl stearidonate | C18:4n-3 | C18 | ω-3 | Marine oils |
| Methyl eicosadienoate | C20:2n-6 | C20 | ω-6 | Lipid signaling |
| Methyl eicosatrienoate (n-6) | C20:3n-6 | C20 | ω-6 | Intermediate in eicosanoid pathway |
| Methyl eicosatrienoate (n-3) | C20:3n-3 | C20 | ω-3 | PUFA biosynthesis marker |
| Methyl arachidonate | C20:4n-6 | C20 | ω-6 | Inflammatory mediator precursor |
| Methyl EPA | C20:5n-3 | C20 | ω-3 | Anti-inflammatory; cardiovascular relevance |
| Methyl DPA | C22:5n-3 | C22 | ω-3 | DHA biosynthesis intermediate |
| Methyl DHA | C22:6n-3 | C22 | ω-3 | Neural and retinal development |
| Methyl tetracosapentaenoate | C24:5n-3 | C24 | ω-3 | Nervous system fatty acid |
| Methyl tetracosahexaenoate | C24:6n-3 | C24 | ω-3 | Very-long-chain PUFA research |
| Compound Name | Type | Carbon Chain | Origin / Application |
|---|---|---|---|
| Methyl iso-C13:0 | Branched | C13 | Microbial lipid |
| Methyl anteiso-C13:0 | Branched | C13 | Low-temperature bacteria |
| Methyl iso-C15:0 | Branched | C15 | Bacterial biomarker |
| Methyl anteiso-C15:0 | Branched | C15 | Soil bacteria marker |
| Methyl iso-C17:0 | Branched | C17 | Cell membrane FA in microbes |
| Methyl anteiso-C17:0 | Branched | C17 | Listeria/Bacillus species |
| Methyl C15:0 | Odd-chain | C15 | Dairy fat biomarker |
| Methyl C17:0 | Odd-chain | C17 | Ruminant lipid metabolism |
| Methyl cyclopropane C17:0 | CFA | C17 | Gram-negative bacteria marker |
| Methyl cyclopropane C19:0 | CFA | C19 | Environmental microbe tracking |
| Methyl cyclopropane C21:0 | CFA | C21 | Bacterial stress response |
| Methyl 10-methyl hexadecanoate | Me-C17:0 | C17 | Actinomycete marker |
| Compound Name | Configuration | Carbon Chain | Source / Significance |
|---|---|---|---|
| Methyl elaidate | trans-C18:1n-9 | C18 | Industrial hydrogenation |
| Methyl trans-vaccenate | trans-C18:1n-7 | C18 | Ruminant lipid |
| Methyl trans-linoleate | trans-C18:2 | C18 | Processed food marker |
| Methyl trans-palmitoleate | trans-C16:1 | C16 | Fermented food marker |
| Compound Name | Isomer | Carbon Chain | Function / Source |
|---|---|---|---|
| Methyl CLA (c9,t11) | CLA1 | C18:2 | Dairy products |
| Methyl CLA (t10,c12) | CLA2 | C18:2 | Metabolic research |
| Methyl conjugated linolenate | CLA3 | C18:3 | PUFA isomer studies |
| Methyl conjugated eicosatrienoate | CLA4 | C20:3 | Bioactive FA analogs |
| Feature | GC-FID | GC-MS |
|---|---|---|
| Sensitivity | High sensitivity for fatty acid quantification | Very high sensitivity and specificity for both identification and quantification |
| Quantification | Excellent for quantitative analysis | Accurate for both quantitative and qualitative analysis |
| Identification | Primarily for quantification; limited to fatty acid methyl esters | Excellent for identifying individual fatty acids and their isomers |
| Complexity | Simpler, faster, and more cost-effective | More complex, time-consuming, but offers detailed analysis |
| Applications | Routine fatty acid profiling, food and oil analysis | Advanced fatty acid and lipidomic profiling, metabolomics, environmental studies |

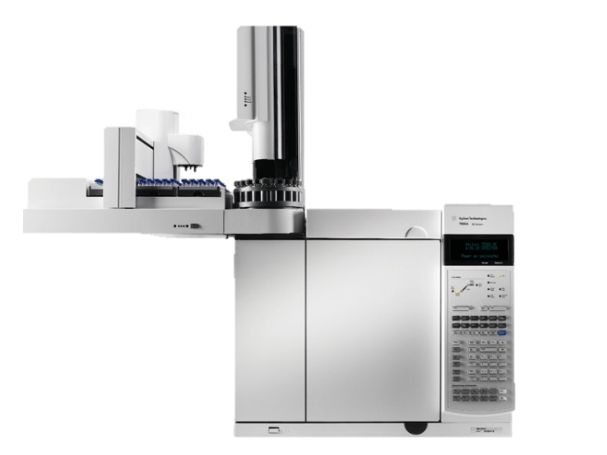
Agilent 7890A GC System (Figure from Agilent)

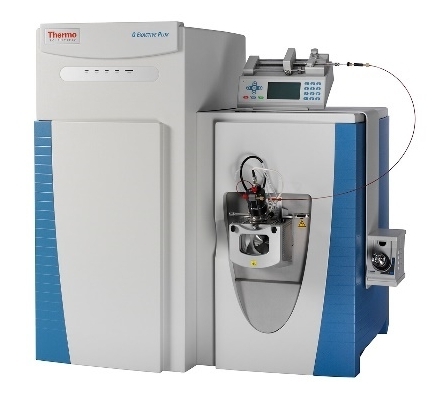
Thermo Fisher Q Exactive (Figure from Thermo Fisher)

Results we provide:
Format:
Contents:
Format:
Contents:
Format:
Explore our Lipidomics Solutions brochure to learn more about our comprehensive lipidomics analysis platform.


Food Quality Control
Determination of fatty acid composition in edible oils and processed foods.

Microbial Lipid Profiling
Characterization of bacterial or algal lipid content for strain differentiation or bioengineering.

Agricultural Product Evaluation
Assessment of lipid profiles in crops and seeds to support breeding or nutritional research.

Environmental Monitoring
Analysis of fatty acid biomarkers in sediments or biofilms to trace pollution or microbial activity.

Industrial Fermentation Optimization
Monitoring of lipid accumulation in engineered strains for biodiesel or bioproduct production.

Nutritional Research
Investigation of dietary fat metabolism and fatty acid intake in controlled feeding studies.
| Requirement | Specification | Details |
|---|---|---|
| Sample Type | Vegetable Oils (Soybean, Canola, Olive), Animal Fats (Beef Tallow, Pork Lard), Dairy Products (Butter, Cheese), Seafood (Fish Oil, Krill Oil), Algal Oil, Biodiesel, Microbial Cultures, Human Body Fluids (Serum, Plasma, Breast Milk), Animal Tissues (Chicken, Beef, Pork) | A wide range of sample types, covering food, biological, bodily fluids, microbial cultures, and animal tissues |
| Sample Size | 5 grams (for solid samples), 10 mL (for liquid samples), 1 mL (for bodily fluids), 5 grams (for animal tissues) | Quantity of sample required for analysis |
| Extraction Solvent | Methanol or Hexane | Choice of solvents for FAME extraction |
| Reaction Temperature | 70°C | Temperature at which the reaction occurs |
| Gas Chromatograph (GC) Method | GC-FID or GC-MS | Analysis methods with FID or Mass Spectrometry detection |
| Column Type | Capillary Column | Type of GC column used for separation |
| Column Temperature | 200°C | Temperature of the GC column during analysis |
| Detection Limits | ≤ 0.05% | Low detection limits to ensure precision |
How should I prepare and store my samples before submission?
Samples should be homogenized (e.g., freeze-dried for tissues, vortexed for liquids) and stored at -80°C to prevent lipid degradation. For microbial cultures, ensure cells are pelleted and rinsed to remove media residues. Avoid repeated freeze-thaw cycles.
What is the minimum sample quantity required for FAME analysis?
The required amount depends on the sample type:
Can FAME analysis distinguish between cis/trans or positional isomers of fatty acids?
Yes, GC-MS with specialized columns (e.g., highly polar cyanopropyl phases) can resolve cis/trans isomers (e.g., oleate vs. elaidate) and some positional isomers (e.g., n-3 vs. n-6 PUFAs). However, conjugated isomers (e.g., CLA) may require supplementary methods like silver-ion chromatography.
How long does a typical FAME analysis workflow take?
From sample receipt to report delivery:
Standard profiling: 5–7 business days.
Complex analyses (e.g., lipid class separation or isomer resolution): 7–10 business days. Expedited services are available upon request.
Can I analyze short-chain fatty acids (SCFAs, e.g., C4:0–C8:0) alongside long-chain FAMEs?
SCFAs require separate protocols due to their high volatility. We recommend using dedicated SCFA analysis (e.g., GC-FID with acidification) or providing additional samples for parallel testing.
How are lipid oxidation products or degraded FAMEs handled during analysis?
We include antioxidant additives (e.g., BHT) during lipid extraction and methylation to minimize oxidation. Suspected degradation (e.g., elevated peroxidation markers) will be flagged in the report with recommendations for re-testing.
Do you support custom FAME panels for specific research needs (e.g., focusing on ω-3/ω-6 ratios only)?
Yes, we offer tailored panels to prioritize specific fatty acid classes (e.g., ω-3/ω-6 PUFAs, branched-chain markers). Custom panels reduce costs and streamline data interpretation for focused studies.
How are data normalized (e.g., per sample weight, total lipid content)?
Data can be normalized flexibly:
Can FAME profiles be linked to functional traits (e.g., membrane fluidity, biofuel efficiency)?
Yes, we provide interpretive annotations (e.g., double bond index, chain length averages) to correlate FAME profiles with membrane properties, energy density, or oxidative stability. Ask about our bioinformatics add-ons for deeper functional insights.
What if my sample contains interfering substances (e.g., pigments, detergents)?
We perform pre-analysis cleanup (e.g., solid-phase extraction, solvent partitioning) to remove common interferents. Inform us in advance if your sample contains unusual contaminants (e.g., surfactants, heavy metals) for optimized processing.
How do I interpret "undetected" or trace-level FAMEs in my report?
Values below the method's limit of detection (LOD) are flagged as "undetected." Trace amounts (between LOD and limit of quantification) are reported semi-quantitatively. We provide LOD/LOQ tables for reference in all reports.
Are statistical comparisons (e.g., ANOVA, PCA) included in standard reports?
Basic statistical tests (e.g., fold change, t-tests) are included. Advanced multivariate analyses (PCA, hierarchical clustering) are optional add-ons. Specify your needs during project setup.
Can I integrate FAME data with other omics datasets (e.g., transcriptomics)?
Absolutely! We export data in compatible formats (Excel, CSV) for integration with tools like MetaboAnalyst or pathway mappers (KEGG, LipidMaps). Ask about multi-omics correlation services.

References
Services:
Resource:
Platform:
Online Inquiry
CONTACT US