Phospholipid Analysis Service

We provide dual-platform LC-MS/MS phospholipid profiling covering 800+ molecular species across 20+ subclasses — from targeted MRM quantification (CV <8%) to untargeted Orbitrap discovery. Whether you are optimizing LNP formulations for mRNA delivery, mapping membrane remodeling in disease, or identifying phospholipid biomarkers for clinical translation, our platform delivers publication-ready quantitative data.

What we analyze: PC, PE, PS, PI, PG, PA, CL — plus lyso-phospholipids (LPC, LPE, LPS, LPI, LPG, LPA), ether-linked/plasmalogen species (PC O-/P-, PE O-/P-), and specialized phospholipids (CDP-DAG, PGP, BMP, PAF, phosphoinositides PIP/PIP₂/PIP₃)

Technology: SCIEX Triple Quad 6500+ (scheduled MRM, LLOQ 0.05 ng/mL) + Thermo Q Exactive HF-X Orbitrap (120K resolution, DDA discovery mode). Dual-column LC: HILIC class separation + reversed-phase C18 species resolution

Applications: LNP & mRNA drug delivery, membrane biology & lipid signaling, disease biomarker discovery, neuro-lipidomics, metabolic disease research

Request Analysis

Submit Your Request Now

×

Our services have earned the trust of companies, schools, and organizations globally, and we remain dedicated to maintaining that trust.

Boston University
University at Buffalo
UMass Medical School
Hawaii Pacific University
Medizinische Fakultät
Louisiana State University
Nyulangone
Nature's Fynd
Dietary Supplement Manufacturer
  • Service We Provide
  • Phospholipid Classes
  • Advantages
  • Workflow
  • Results and Data Analysis
  • Sample Requirements
  • FAQ

What Are Phospholipids and Why Profile Them?

Phospholipids are amphipathic lipids with a glycerol backbone, two fatty acyl chains (sn-1 and sn-2), and a phosphate-containing headgroup (sn-3). This architecture drives spontaneous bilayer assembly, making phospholipids the structural basis of all cellular membranes — and the source of critical lipid signaling molecules (DAG, IP₃, LPA, PAF, eicosanoid precursors). Quantitative phospholipid profiling reveals the lipid environment in which membrane proteins operate — insights that genomics and proteomics alone cannot provide.

Comprehensive phospholipid profiling spans the translational research spectrum:

Our dual-platform approach — targeted MRM for quantification, Orbitrap for discovery — provides both hypothesis-driven validation and unbiased exploration from the same sample.

Phospholipid Profiling Solutions

From focused quantification to comprehensive discovery to custom methods — choose the approach that fits your research question, or combine them in a discovery-to-validation workflow.

Targeted Phospholipid Panel (MRM Quantification)

Absolute quantification of 300+ pre-defined phospholipid species across 15 subclasses by scheduled MRM on SCIEX Triple Quad 6500+. Isotope dilution with class-specific internal standards. Report includes species-level concentration (pmol/mg or nmol/mL), class totals, and mol% composition. LLOQ 0.05–0.1 ng/mL, intra-day CV<5%, inter-day CV <8%, linearity r² ≥ 0.995.Ideal for biomarker validation, PK/PD studies, LNP composition QC, and hypothesis-driven research.

Untargeted Phospholipid Profiling (Discovery Mode)

Comprehensive detection of 500–800+ phospholipid species by data-dependent acquisition (DDA) on Thermo Q Exactive HF-X Orbitrap at 120,000 resolution (MS1) and 30,000 resolution (MS2). Lipid identification against LIPID MAPS and in-house spectral libraries (>2,500 curated entries) with LSI confidence levels. Mass accuracy<3 ppm, identification confidence scores reported for every annotation.Ideal for discovery research, hypothesis generation, membrane remodeling studies, and comparative lipidomics.

Custom Method Development

Validated MRM or HRMS method development for rare phospholipids, non-standard sample types, or specialized applications. Examples: phosphoinositide panel (PIP, PIP₂, PIP₃) for signaling studies, oxidized phospholipid (OxPL) profiling for oxidative stress, BMP (bis(monoacylglycero)phosphate) quantification for lysosomal storage disorders, and bacterial phospholipids with cyclopropane or branched-chain fatty acids. Method validation includes linearity (r² ≥ 0.995), accuracy (85–115% recovery), and precision (CV<10%).

Optional Add-On Analyses — Available for both targeted and untargeted projects:

Pathway Enrichment Analysis — KEGG and Reactome pathway mapping of significantly altered phospholipid classes. Identifies upstream enzymatic nodes (PLA₂, LPCAT, CDS, PGS) predicted to drive observed changes.

Cohort Comparison & Machine Learning — OPLS-DA, random forest classification, and ROC analysis for biomarker panel selection. Cross-validation with permutation testing to assess model robustness.

Fatty Acyl Composition Profiling — Hydrolysis and GC-MS or LC-MS analysis of total fatty acid methyl esters (FAMEs) from the phospholipid fraction. Chain length and unsaturation distribution per class.

Detectable Phospholipid Classes and Species Coverage

Our combined targeted and untargeted platforms cover 800+ phospholipid molecular species across 20+ subclasses. Coverage depth varies by sample type — the table below reflects routine detection in mammalian tissue or cell lysate.

  • Glycerophospholipids
  • Lyso- & Ether-Linked
  • Special Phospholipids

Major Glycerophospholipid Classes

The canonical membrane phospholipids — each with distinct headgroup chemistry, subcellular localization, and biological function.

ClassAbbreviationTypical Species DetectedIon ModeBiological FunctionSubcellular Enrichment
PhosphatidylcholinePC120–180PositiveMajor membrane structural lipid (~40–50% of total PL); surfactant; lipoprotein component; source of DAG and PAF signalingER, plasma membrane, mitochondrial outer membrane, lipoproteins
PhosphatidylethanolaminePE80–120Positive/NegativeMembrane curvature generation (cone shape); autophagy (LC3 lipidation); mitochondrial cristae architectureInner mitochondrial membrane, plasma membrane inner leaflet
PhosphatidylserinePS30–50NegativeApoptotic cell clearance ("eat-me" signal); blood coagulation (platelet activation); PKC signaling; synaptic functionPlasma membrane inner leaflet (asymmetric)
PhosphatidylinositolPI25–40NegativePrecursor for phosphoinositide signaling (PIP, PIP₂, PIP₃); GPI-anchored protein tethering; membrane traffickingPlasma membrane, Golgi, endosomes
PhosphatidylglycerolPG15–25NegativePulmonary surfactant (DPPG); CL precursor in mitochondria; bacterial membrane lipid (Gram-positive)Mitochondria, lung lamellar bodies
Phosphatidic AcidPA10–20NegativeCentral biosynthetic intermediate; mTOR signaling; membrane fission/fusion; stress-induced signalingER, plasma membrane (transient)
CardiolipinCL150–200NegativeMitochondria-exclusive: cristae architecture, respiratory chain supercomplex assembly, cytochrome c-mediated apoptosisInner mitochondrial membrane (exclusively)

Lysophospholipids, Ether-Linked Phospholipids & Plasmalogens

Lyso-phospholipids are monoacyl signaling molecules generated by PLA₁/PLA₂-mediated deacylation — key intermediates in the Lands' cycle remodeling pathway. Ether-linked phospholipids contain an alkyl (O-) or alkenyl (P-, plasmalogen) linkage at sn-1 instead of an ester bond, conferring antioxidant properties and enhanced membrane fusion capacity.

ClassAbbreviationTypical Species DetectedBiological Relevance
LysophosphatidylcholineLPC25–40Most abundant plasma lyso-PL; LPCAT remodeling substrate; oxidized LDL component; GPR119/G2A receptor ligand
LysophosphatidylethanolamineLPE15–25Minor plasma lyso-PL; implicated in neuronal differentiation and plant senescence signaling
LysophosphatidylserineLPS5–12Mast cell degranulation signal; GPR34 ligand; neuroinflammatory mediator
LysophosphatidylinositolLPI5–10GPR55 ligand; endocannabinoid-related signaling; cancer cell motility and invasion
LysophosphatidylglycerolLPG5–10TLR4 agonist; Gram-positive bacterial membrane lipid; surfactant metabolism
Lysophosphatidic AcidLPA8–15Major bioactive lipid mediator; autotaxin-ATX substrate; LPAR1–6 signaling: proliferation, migration, fibrosis
Ether-linked PC (PC O- / PC P-)PC O-, PC P-20–35Plasmalogen PC enriched in heart and brain; antioxidant function via vinyl ether bond; PAF precursor
Ether-linked PE (PE O- / PE P-)PE O-, PE P-30–50Plasmalogen PE comprises ~50% of total PE in brain, heart, and neutrophils; ferroptosis regulation; membrane fusion
Ether-linked LPC / LPELPC O-, LPE O-10–20Degradation products of ether-linked PL; potential biomarkers for peroxisomal disorders (e.g., RCDP, Zellweger)

Specialized Phospholipids and Signaling Intermediates

Beyond canonical membrane phospholipids, these specialized classes serve as biosynthetic intermediates, signaling molecules, and organelle-specific markers. Available through custom development or as add-on panels to targeted/untargeted workflows.

ClassAbbreviationFunctionDetection Method
CDP-DiacylglycerolCDP-DAGCommon precursor for PI, PG, CL, and PS biosynthesis; CDS1/CDS2 enzyme productMRM, negative ion mode
PhosphatidylglycerophosphatePGPTransient intermediate in CL biosynthesis; PGS1 product; PTPMT1 substrateMRM, negative ion mode
Bis(monoacylglycero)phosphateBMPLate endosome / lysosome-specific; regulates cholesterol trafficking and sphingolipid degradation; elevated in Niemann-Pick and drug-induced phospholipidosisMRM, negative ion mode
Platelet-Activating FactorPAFPotent pro-inflammatory ether-linked phospholipid; 1000× more potent than histamine; PAF receptor signalingMRM, positive ion mode
Phosphatidylinositol PhosphatesPIP, PIP₂, PIP₃Phosphoinositide signaling: PI3K/Akt pathway (PIP₃), PLC substrate (PIP₂), endosomal trafficking (PI3P)MRM with phosphate-specific derivatization

Why Choose Our Phospholipid Analysis Platform

  • Industry-leading coverage depth: 800+ phospholipid species across 20+ subclasses — including ether-linked, plasmalogen, and lyso-forms that many shotgun lipidomics platforms report only at the class level. Our isomer-resolved identification (sn-position and C=C localization) exceeds standard lipidomics resolution.
  • Dual-platform flexibility: Targeted MRM on SCIEX Triple Quad 6500+ for absolute quantification (LLOQ 0.05 ng/mL, CV<8%) and untargeted DDA on Thermo Q Exactive HF-X Orbitrap (120K resolution, <3 ppm mass accuracy) for discovery — choose one platform or both from the same sample.
  • Rigorous quantification: Class-specific isotope-labeled internal standards in every sample, external calibration with authentic phospholipid standards (r² ≥ 0.995), pooled QC samples every 8–10 injections, and NIST SRM 1950 plasma reference material for clinical studies.
  • Isomer-level structural annotation: sn-1/sn-2 positional isomers resolved by diagnostic MS/MS fragment ion ratios; C=C double bond localization via EIEIO-MS/MS or OzID for ω-3 vs ω-6 discrimination — capabilities not offered by standard shotgun lipidomics.
  • Oxidation-controlled workflow: Nitrogen-atmosphere extraction at 4°C with BHT antioxidant (50 μM), amber vial storage under argon, and batch QC monitoring of oxidized phospholipid levels — ensuring OxPL data reflect biology, not artifacts.
  • Batch-scalable workflow: From single-sample pilot studies to 500+ sample cohorts, our standardized extraction and acquisition protocols ensure consistent data quality across projects of any scale. Optional add-on analyses (pathway enrichment, cohort comparison) are seamlessly integrated into the data delivery pipeline.
  • Publication-ready data delivery: Raw MRM chromatograms, integration boundaries, MS/MS spectra, and complete QC metrics provided alongside processed data tables — enabling independent verification and journal submission without requesting additional raw files.
  • Expert phospholipid biochemistry team: Scientists with experience across LNP formulation, membrane biophysics, mitochondrial biology, and clinical lipidomics. Custom method development and consultation available throughout the project lifecycle.

Phospholipid Analysis Workflow

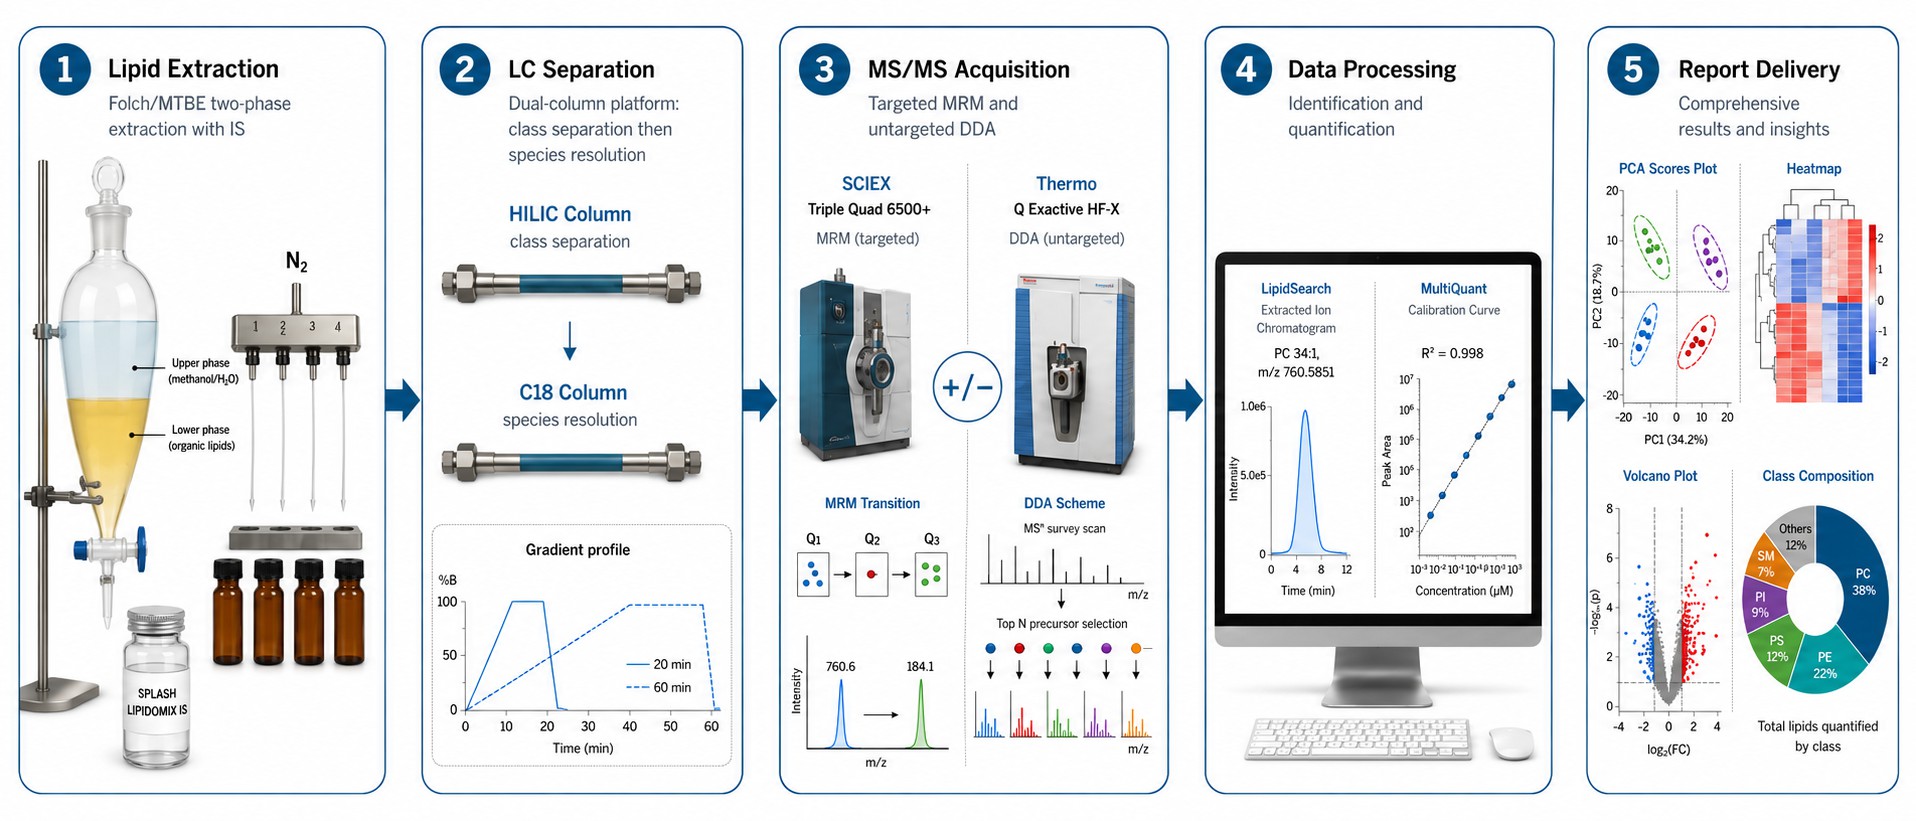
Phospholipid analysis workflow: extraction → LC separation → MS/MS acquisition → data processing → report delivery

Technology Platform for Phospholipid Analysis

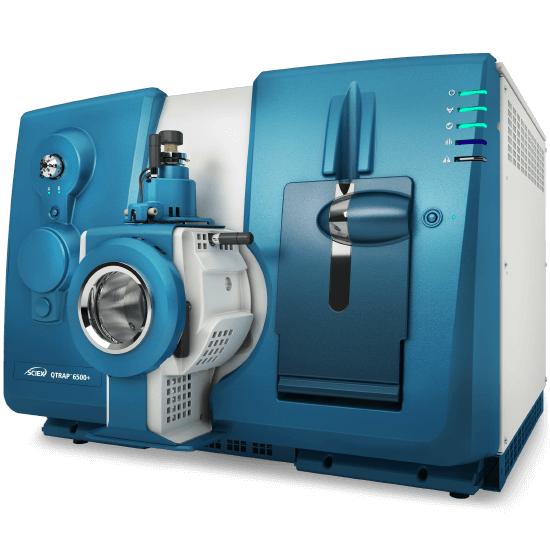
SCIEX Triple Quad 6500+

SCIEX Triple Quad 6500+ — Scheduled MRM in both positive and negative ion mode with rapid polarity switching (50 ms). PC, SM, and LPC detected as [M+H]⁺ in positive mode; PE, PS, PI, PG, PA, CL, and LPA detected as [M-H]⁻ in negative mode. Isotope dilution quantification using ¹³C-labeled and odd-chain internal standards. MS3 fragmentation capability on the QTRAP linear ion trap for isobaric isomer resolution.

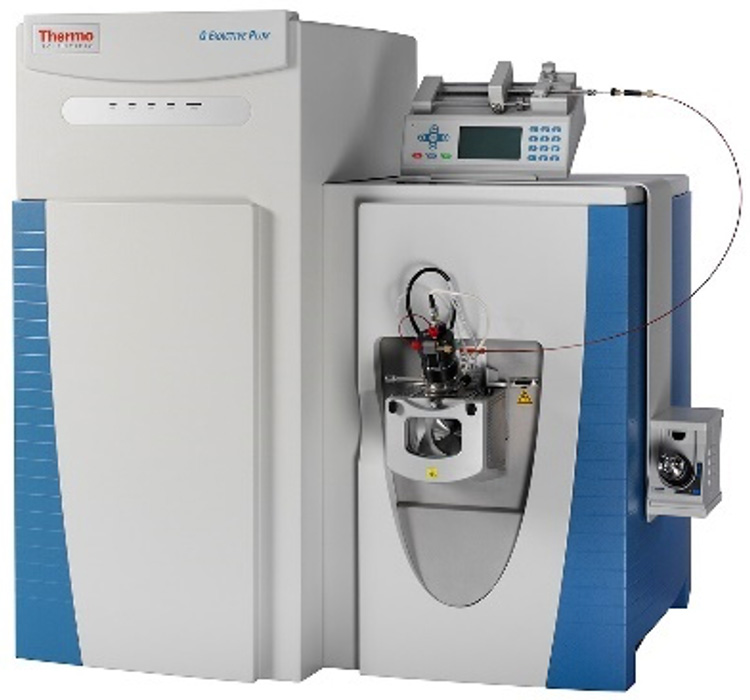
Thermo Q Exactive HF-X

Thermo Q Exactive HF-X Orbitrap — High-resolution (120,000 at m/z 200) full-scan MS1 with data-dependent MS2 (Top 15, 30,000 resolution) for untargeted phospholipid discovery. HCD fragmentation with stepped collision energies (20, 30, 40 eV) for comprehensive structural information. Mass accuracy<3 ppm with external calibration; <1 ppm with internal lock mass (polysiloxane background ion m/z 445.1200).

LC-MS/MS Method Specifications

ParameterSpecification
Targeted Panel — ChromatographyReversed-phase C18 (2.1 × 100 mm, 1.7 μm); 20-min gradient (40–100% B); 55°C column temperature; mobile phase A: 60:40 acetonitrile/water + 10 mM ammonium formate + 0.1% formic acid; B: 90:10 isopropanol/acetonitrile + 10 mM ammonium formate + 0.1% formic acid
Untargeted Profiling — ChromatographyExtended 60-min gradient for isomer resolution; optional HILIC pre-separation (2.1 × 150 mm, 3 μm) for class-level fractionation before RP species resolution
IonizationDual-polarity ESI with rapid switching (50 ms cycle time); source temperature 350°C; ion spray voltage ±4.5 kV; curtain gas 35 psi; GS1/GS2 50 psi
MRM AcquisitionScheduled MRM with 45-s detection windows; minimum 8 data points per peak; dwell time ≥10 ms per transition; 2–3 transitions per analyte (quantifier + qualifier)
Orbitrap AcquisitionFull scan MS1: m/z 200–1,600 at 120,000 resolution; DDA Top 15: 30,000 resolution; stepped HCD (20/30/40 eV); dynamic exclusion 10 s; AGC target 1e6 (MS1) / 5e5 (MS2)
QuantificationIsotope dilution with class-specific internal standards; external calibration with 7–9 point curves (r² ≥ 0.995); SPLASH LIPIDOMIX or custom deuterated standard cocktails
LLOQ (Targeted Panel)0.05–0.1 ng/mL (on-column) for major phospholipid classes; S/N ≥ 10:1 at LLOQ; 4 orders of magnitude linear dynamic range
PrecisionIntra-day CV<5%; inter-day CV <8%; pooled QC CV <15% for ≥85% of detected species (acceptance criteria)
Mass Accuracy<3 ppm (Orbitrap MS1); <5 ppm (Orbitrap MS2); unit resolution (Q1/Q3, Triple Quad MRM)
Isomer ResolutionBaseline separation of species differing by ≥1 double bond (60-min gradient); sn-positional isomers resolved by MS/MS fragment ion ratios; C=C position via EIEIO/OzID (custom development)
Extraction Recovery>85% for all major phospholipid classes (PC, PE, PS, PI, PG, PA); >75% for CL and lyso-phospholipids; validated by spike-recovery with deuterated standards

Results and Data Analysis — What You Receive

Comprehensive Phospholipid Profiling Report

Quantitative results:

  • Species-level abundance table for all detected phospholipids (pmol/mg protein, nmol/mL, or pmol/10⁶ cells — normalized to your preference).
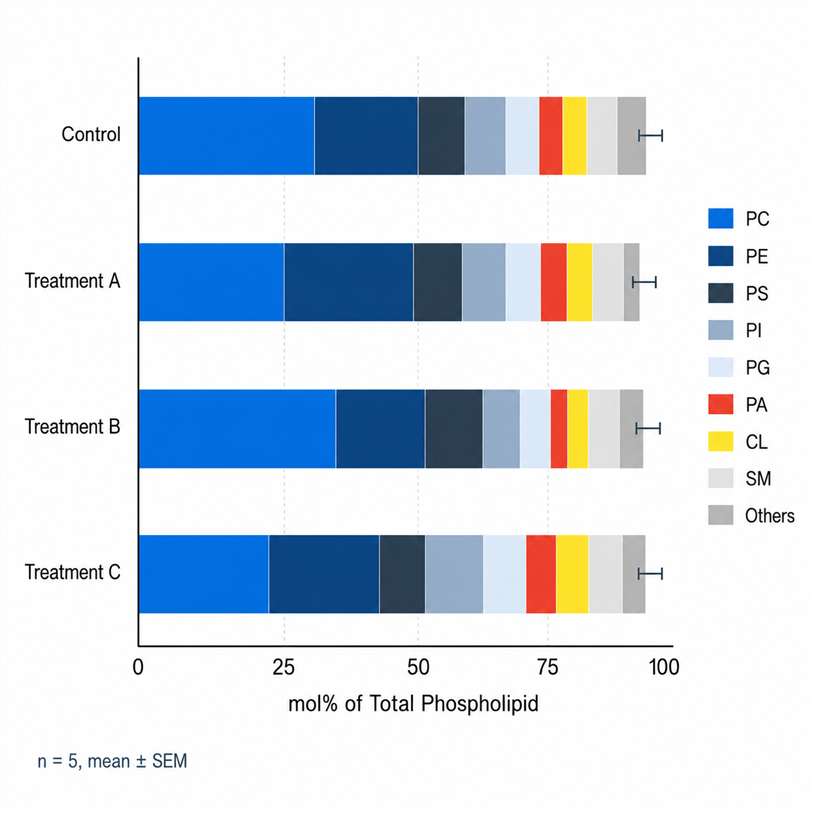
  • Phospholipid class totals and mol% composition for cross-group comparison.
  • Fatty acyl composition profiles: chain length distribution (C14–C22) and unsaturation index (total double bonds) per phospholipid class.
  • Specific ratios of biological interest: PC/PE ratio (membrane fluidity index), saturated/unsaturated PC ratio, CL/MLCL ratio (mitochondrial health), LPC/PC ratio (PLA₂ activity surrogate).

Statistical analysis:

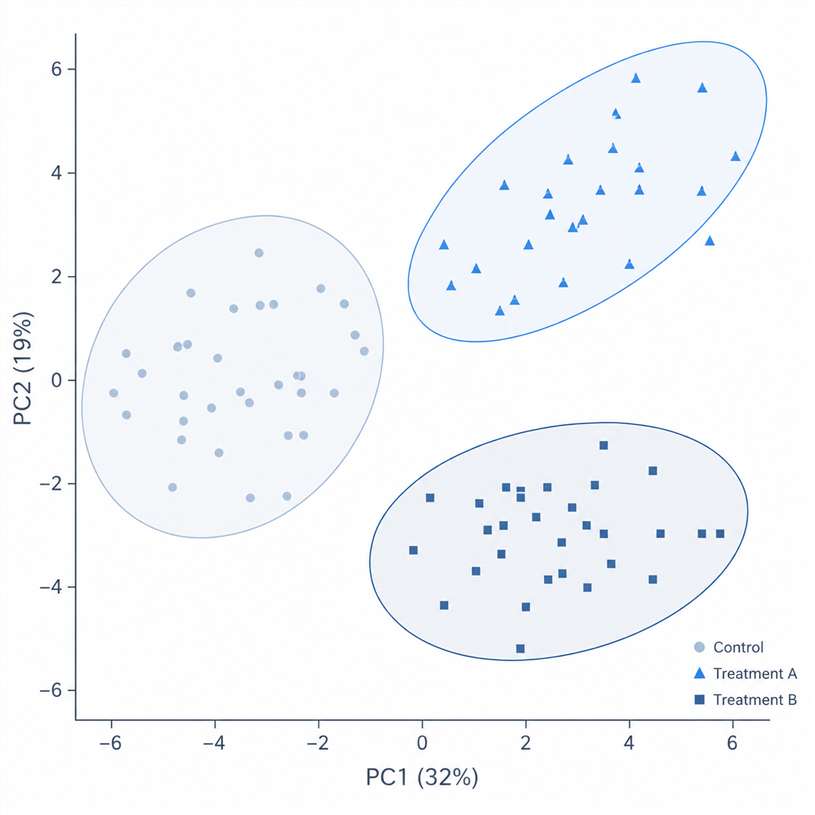
  • Principal component analysis (PCA) — scores and loadings plots with 95% confidence ellipses.
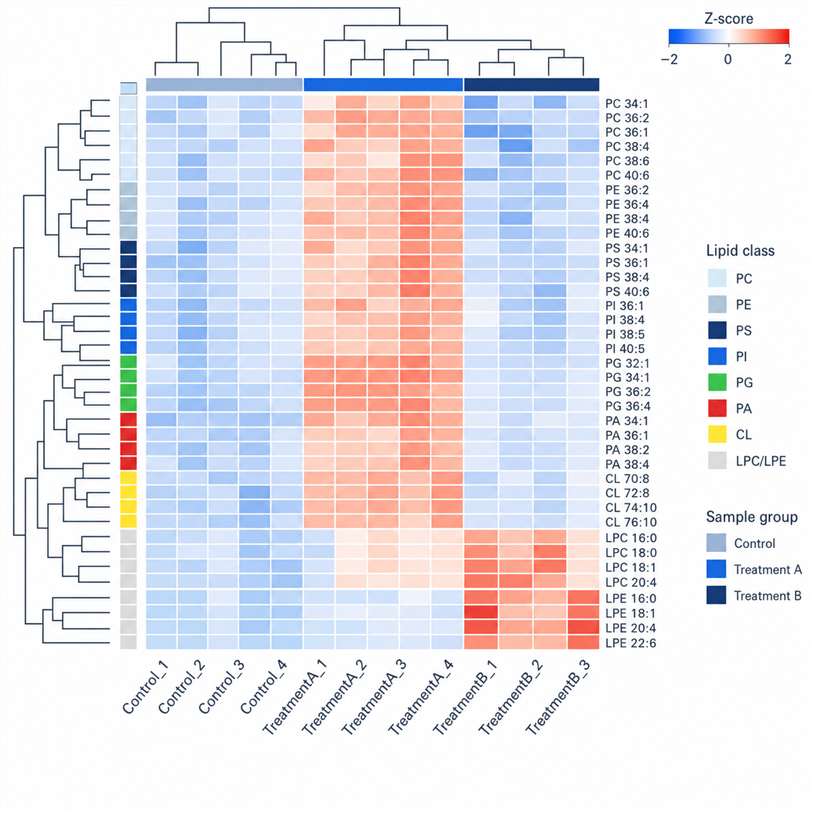
  • Hierarchical clustering heatmap of the top 50 differentially abundant species.
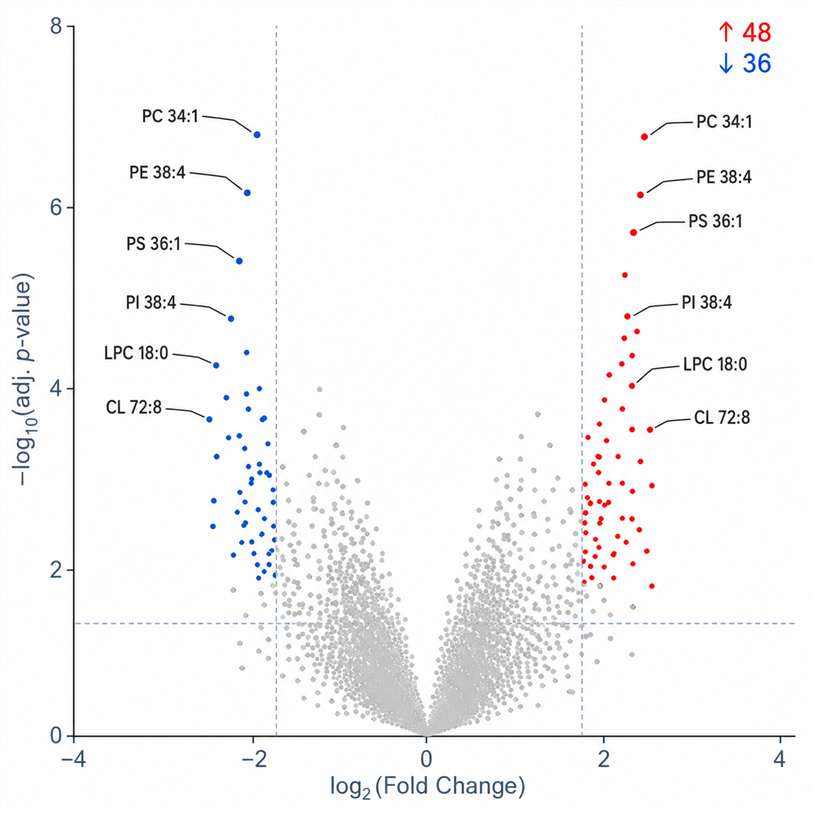
  • Volcano plot (fold change vs. adjusted p-value) for pairwise comparisons.
  • Group-wise comparisons with Student's t-test or ANOVA, multiple testing correction (Benjamini-Hochberg FDR).
PCA scores plot of phospholipid profiles across experimental groups

PCA scores plot: clear group separation by phospholipid composition.

Heatmap of top 40 differentially abundant phospholipid species

Heatmap: hierarchical clustering of differentially abundant phospholipid species.

Volcano plot of differential phospholipid abundance

Volcano plot: significantly altered phospholipid species between groups.

Phospholipid class composition stacked bar chart

Class composition: phospholipid subclass distribution across conditions.

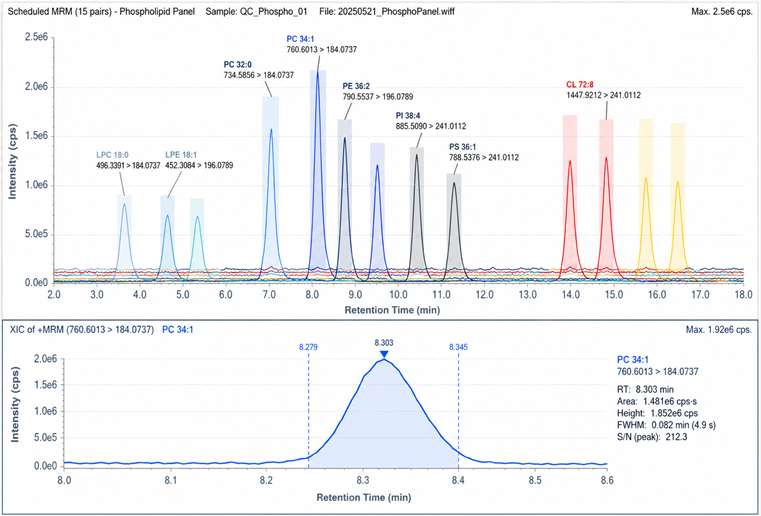
Scheduled MRM chromatogram overlay showing baseline separation of major phospholipid classes

MRM chromatogram: representative targeted panel data showing 300+ phospholipid species resolved in a single 20-min LC-MS/MS run.

Data Deliverables & File Formats

Every report includes:

  • Excel workbook — All species-level data tables with mean, SD, CV, fold change, and adjusted p-values across groups.
  • PDF report — Publication-quality figures (PCA, heatmap, volcano plot, class composition charts) with figure legends and statistical summary.
  • Raw data package — MRM chromatogram traces (.wiff or .mzML format), MS/MS spectra for all identified species, and integration boundary files for independent verification with Skyline or MultiQuant.
  • Methodology document — Complete extraction protocol, LC gradient, MRM transition list, and QC metrics for direct inclusion in the methods section of your manuscript.
  • QC report card — Internal standard recovery rates per sample, pooled QC CV distribution histogram, system suitability injection results, and blank extraction background levels.

Optional Advanced Analysis Modules

Available as add-ons to any project:

  • Pathway enrichment analysis: KEGG and Reactome over-representation analysis of significantly altered phospholipid classes. Maps results onto glycerophospholipid metabolism, ether lipid metabolism, and arachidonic acid metabolism pathways.
  • Cohort comparison & machine learning: OPLS-DA (supervised) with S-plot for biomarker identification; random forest classification with variable importance ranking; ROC curve analysis for candidate biomarker panels.
  • Correlation analysis: Pairwise Spearman/Pearson correlations between phospholipid species and clinical parameters (BMI, HOMA-IR, ALT, etc.) with correlation heatmap and scatter plots.
  • Longitudinal / time-course analysis: Repeated-measures ANOVA and trajectory clustering for time-series phospholipid data (e.g., drug treatment time course, disease progression).

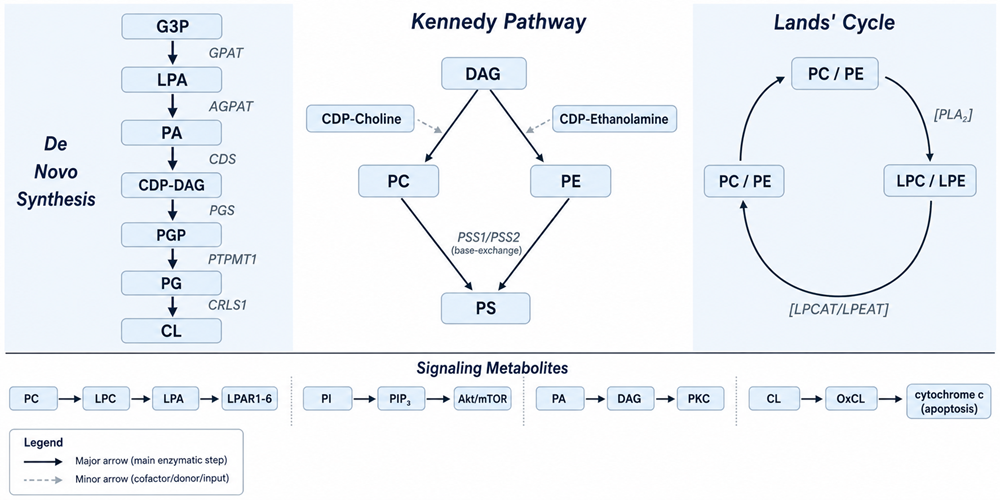
Glycerophospholipid biosynthesis and remodeling pathway: Kennedy pathway, Lands' cycle, and signaling metabolitesGlycerophospholipid Biosynthesis and Remodeling: De novo Kennedy pathway (left), headgroup activation (center), Lands' cycle remodeling (right), and downstream signaling metabolites (bottom)



Learn more about our targeted lipidomics platform and phospholipid analysis capabilities. Download the complete service brochure for method details, validation data, and application examples.

Download Brochure

Applications of Phospholipid Profiling

LNP Formulation & mRNA Delivery

Quantify helper lipid composition (DSPC, DOPC, DOPE) with QC-grade precision (CV<5%). Monitor phospholipid-dependent encapsulation efficiency, storage stability, and organ-specific tropism. Correlate lipid composition with in vivo expression and CRISPR editing efficiency.

Membrane Biology & Cell Signaling

Characterize plasma membrane asymmetry (PS exposure, PE externalization) during apoptosis, platelet activation, and viral entry. Quantify phosphoinositide dynamics (PIP₂/PIP₃) and map raft vs. non-raft microdomain phospholipid composition.

Biomarker Discovery for Disease Research

Identify circulating phospholipid signatures across cancer types, cardiovascular disease, neurodegeneration, and metabolic disorders. Discovery-to-validation pipeline transitions candidates from untargeted profiling to targeted MRM without method redevelopment.

Neuro-Lipidomics

Profile brain-region-specific phospholipids with emphasis on plasmalogen PE (~50% of brain PE, enriched in DHA/AA). Track plasmalogen depletion in Alzheimer's, Parkinson's, and TBI models. Detect BMP accumulation in lysosomal storage disorders.

Metabolic & Mitochondrial Disease

Assess hepatic PC/PE ratio shifts and saturated PC accumulation in NAFLD/NASH. Quantify cardiolipin remodeling in obesity and diabetes — loss of tetralinoleoyl-CL (CL 72:8) correlates with insulin resistance. Profile skeletal muscle phospholipid adaptation to diet and aging.

Drug Safety & Phospholipidosis

Monitor drug-induced phospholipidosis from cationic amphiphilic compounds via BMP and total phospholipid accumulation. Track oxidized phospholipid species as markers of drug-induced oxidative stress and mitochondrial toxicity.

Sample Requirements for Phospholipid Analysis

Sample TypeSample Collection & HandlingRecommended MinimumStorage & Shipping
Cultured CellsWash twice with ice-cold PBS; scrape and pellet at 4°C, 300 × g for 5 min. Remove supernatant completely. For adherent cells, quench directly in ice-cold methanol after PBS wash.5 × 10⁶ cells (targeted); 1 × 10⁷ cells (untargeted)Snap-freeze pellet in liquid nitrogen. Store at –80°C. Ship on dry ice. Avoid freeze-thaw. Include ≥3 biological replicates per condition.
Animal / Plant TissuePerfuse with ice-cold PBS (animal tissues) to remove blood. Dissect rapidly on ice. For brain: region-specific dissection. For liver: perfuse via portal vein. Weigh tissue before freezing.10–50 mg wet weight (targeted); 30–100 mg (untargeted)Snap-freeze immediately in liquid nitrogen. Store at –80°C. Ship on dry ice. Include tissue weight for normalization. For oxidation-prone samples, add BHT (50 μM) to homogenization buffer.
Plasma / SerumCollect blood in EDTA-K₂ tubes (avoid heparin — interferes with MS). Centrifuge at 1,500 × g for 10 min at 4°C within 2 hours of collection. Aliquot supernatant immediately.50–100 μL (targeted); 100–200 μL (untargeted)Store at –80°C in low-retention tubes. Ship on dry ice. ≤2 freeze-thaw cycles. NIST SRM 1950 reference plasma included as QC for clinical studies.
UrineCollect midstream urine. Centrifuge at 2,000 × g for 10 min at 4°C to remove debris. Add 0.1% BHT as antioxidant (optional). Record total volume.200–500 μLStore at –80°C. Ship on dry ice. Normalize to creatinine concentration if available.
Isolated Mitochondria / Membrane FractionsIsolate by differential centrifugation or kit-based method. Wash pellet with ice-cold PBS or mitochondrial isolation buffer. Determine protein concentration by BCA or Bradford assay.20–100 μg mitochondrial proteinSnap-freeze pellet. Store at –80°C. Ship on dry ice. Provide protein concentration and isolation protocol for normalization.
Exosomes / Extracellular VesiclesIsolate by ultracentrifugation (100,000 × g, 70 min), size-exclusion chromatography, or commercial kit. Characterize by NTA (particle count and size) and Western blot (CD9, CD63, CD81).≥10 μg EV protein or ≥1 × 10⁹ particlesStore at –80°C. Ship on dry ice. Provide NTA and protein data. Include equal particle numbers across samples for comparative analysis.
Client-Prepared Lipid ExtractsExtract under nitrogen atmosphere at 4°C (modified Folch, Bligh-Dyer, or MTBE protocol). Include internal standards before extraction. Dry extract under argon or nitrogen. Resuspend in chloroform:methanol (2:1) or isopropanol.Lipid extract equivalent to the sample amounts aboveShip in amber glass vials with PTFE-lined caps on dry ice. Provide detailed extraction protocol, internal standard information, and tissue weight / protein / volume data for normalization. Include blank extraction control.

Frequently Asked Questions About Phospholipid Analysis

What phospholipid classes can you detect and quantify?

We cover 20+ subclasses — glycerophospholipids, lysophospholipids, ether-linked/plasmalogen species, and specialized phospholipids like phosphoinositides and BMP. Our combined platform detects 800+ molecular species in total, with 300–400 routinely quantified in a typical mammalian tissue or cell sample. Plasma yields 200–250 species; tissue and mitochondria yield the highest coverage (350–500 species). See the Detectable Phospholipid Classes tables above for a complete listing with biological context.

What is the difference between targeted (MRM) and untargeted (Orbitrap) phospholipid analysis — and which should I choose?

Targeted analysis uses scheduled MRM on a triple quadrupole mass spectrometer to measure pre-selected phospholipid species with absolute quantification. Advantages: high sensitivity (LLOQ 0.05 ng/mL), precision (CV<8%), wide dynamic range (4 orders, r² ≥ 0.995), and absolute concentration reporting (pmol/mg or nmol/mL). Best for: biomarker validation, PK/PD studies, LNP QC, and any study where you know which phospholipids matter and need to measure them accurately and reproducibly.

Untargeted profiling uses data-dependent acquisition on an Orbitrap to detect all ionizable phospholipid species without pre-selection. Advantages: broader coverage (500–800+ species), discovery of unexpected changes, and relative quantification across groups. Best for: hypothesis generation, exploratory research, membrane remodeling studies, and any project where you don't yet know which phospholipid species are important.

Our recommendation: Most projects benefit from a discovery-to-validation workflow — start with untargeted profiling to identify candidates, then validate the top hits with targeted MRM quantification. Because we maintain both platforms, you can transition seamlessly without re-extracting samples or redeveloping methods.

How do you ensure phospholipid data quality and quantitative accuracy?

We implement a rigorous multi-layered QC strategy:

  • Class-specific internal standards (SPLASH LIPIDOMIX or custom deuterated cocktails) spiked into every sample before extraction — corrects for extraction efficiency, ion suppression, and instrument drift.
  • Pooled QC samples injected every 8–10 injections; acceptance criteria: CV<15% for ≥85% of detected species.
  • External calibration curves from authentic phospholipid standards (7–9 points, r² ≥ 0.995) at the start and end of each batch.
  • System suitability tests before each batch — retention time stability (±0.05 min), mass accuracy (<3 ppm), detector response.
  • Blank extractions monitor laboratory background; species with blank signal >20% of sample signal flagged.
  • NIST SRM 1950 reference plasma included in clinical studies.

The complete QC report is delivered with every project.

Can you distinguish phospholipid isomers — species with the same molecular formula but different fatty acid composition or double bond positions?

Yes — isomer-resolved identification is a core capability that differentiates our LC-MS/MS platform from standard shotgun lipidomics. We employ three complementary strategies:

  • Chromatographic resolution: Isobaric species differing by one double bond or carbon number are baseline-resolved on our 60-min RP gradient (e.g., PC 34:1 vs. PC 34:2 elute with ≥30 s separation).
  • sn-Positional isomers: In negative ion mode CID, the intensity ratio of fatty acid carboxylate fragment ions (RCOO⁻) differs between sn-1 and sn-2 positions, enabling positional assignment.
  • C=C double bond localization (custom development add-on): For ω-3 vs. ω-6 discrimination (e.g., 18:3 n-3 vs. 18:3 n-6 within the same species), we offer EIEIO-MS/MS or OzID-based approaches — critical for dietary fatty acid and arachidonic acid metabolism studies.

What sample types can you accept — and what are the minimum requirements?

We accept: cultured cells (≥5 × 10⁶ targeted, ≥1 × 10⁷ untargeted), animal/plant tissues (10–100 mg), plasma or serum (≥50 μL targeted, ≥100 μL untargeted), urine (≥200 μL), isolated mitochondria/membrane fractions (≥20 μg protein), exosomes/EVs (≥10 μg protein or ≥1 × 10⁹ particles), and client-prepared lipid extracts.

Key collection guidelines:

  • Use EDTA-K₂ tubes for plasma (avoid heparin — interferes with MS ionization)
  • Centrifuge blood within 2 hours of collection; snap-freeze all samples in liquid nitrogen
  • Store at –80°C; ≤2 freeze-thaw cycles; ship on dry ice
  • For oxidation-sensitive species (plasmalogens, CL, oxidized PL), add BHT antioxidant (50 μM) to homogenization buffers

See the Sample Requirements table above for detailed protocols per sample type.

What do I receive in the final data package?

Every project includes:

  • Excel workbook — species-level data with mean, SD, CV, fold change, and adjusted p-values
  • PDF report — publication-ready figures (PCA, heatmap, volcano plot, class composition charts)
  • Raw data package — MRM chromatograms (.wiff or .mzML), MS/MS spectra, integration boundaries
  • Methodology document — complete extraction protocol, LC gradient, MRM transition list, and QC metrics for manuscript methods section
  • QC report card — internal standard recoveries, pooled QC CV distribution, system suitability results

We provide all data necessary for independent verification and publication — no need to request additional raw files after report delivery.

My project involves lipid nanoparticles (LNPs) for mRNA delivery. Can your phospholipid panel support formulation development?

Absolutely — LNP characterization is one of our fastest-growing application areas. Our targeted MRM panel quantifies the four canonical LNP lipids — ionizable lipid (if reference standard available), DSPC or DOPC (helper phospholipid), cholesterol, and PEG-lipid — with QC-grade precision (CV<5%). Beyond quantification, we monitor:

  • Phospholipid hydrolysis/degradation kinetics under accelerated stability conditions
  • Lyso-PC accumulation as a degradation marker
  • Phospholipid-dependent differences in encapsulation efficiency and in vivo activity
  • Organ-specific phospholipid accumulation after LNP administration (tissue distribution)

For novel ionizable lipids or PEG-lipid conjugates, we develop custom MRM methods. Include formulation buffer blanks and empty LNP controls in your study design for accurate normalization.

* Our services can only be used for research purposes and Not for clinical use.

Services:


Online Inquiry

CONTACT US

Copyright © 2026 Creative Proteomics. All rights reserved.