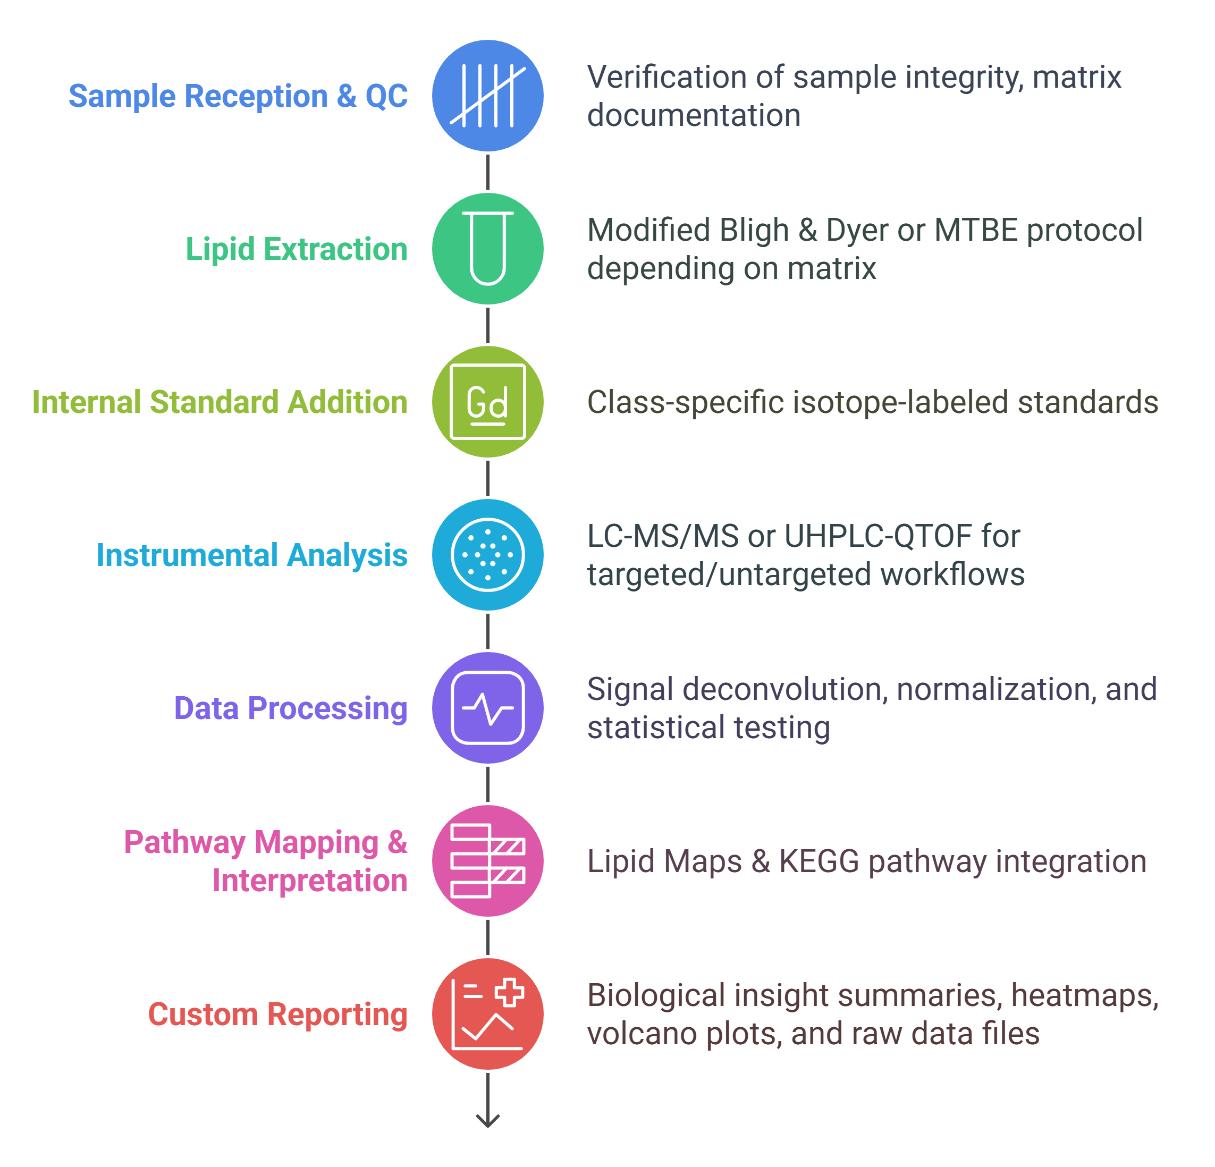
Targeted Sphingolipid Quantification
Absolute quantification of individual sphingolipids using class-specific internal standards and LC-MS/MS methods; ideal for biomarker validation.
Creative Proteomics offers high-resolution sphingolipid analysis services using LC-MS/MS and Orbitrap platforms to deliver accurate quantification of over 150 sphingolipid species, including ceramides, sphingomyelins, glycosphingolipids, and signaling lipids like S1P. Our service enables researchers to decode lipid pathway disruptions, identify disease biomarkers, and support drug development with precise, reproducible lipidomic data.
Submit Your Request Now
×Our services have earned the trust of companies, schools, and organizations globally, and we remain dedicated to maintaining that trust.


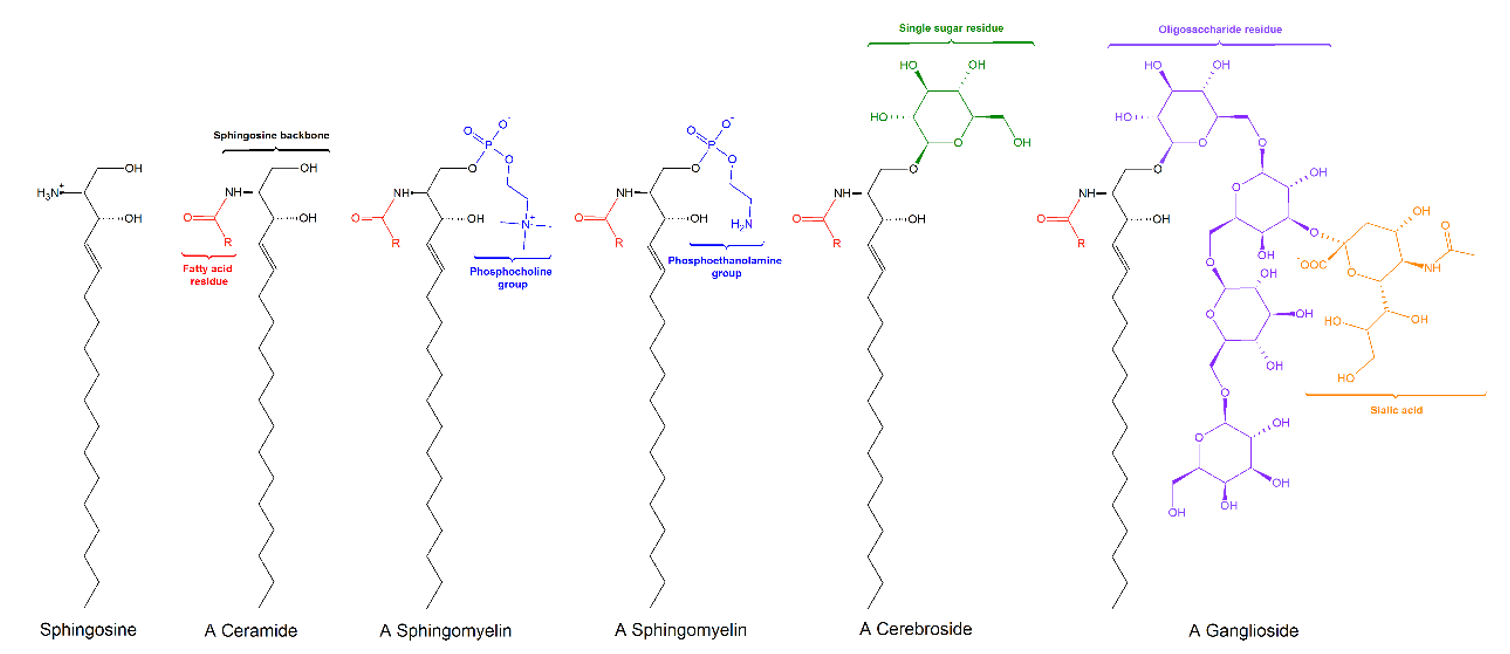
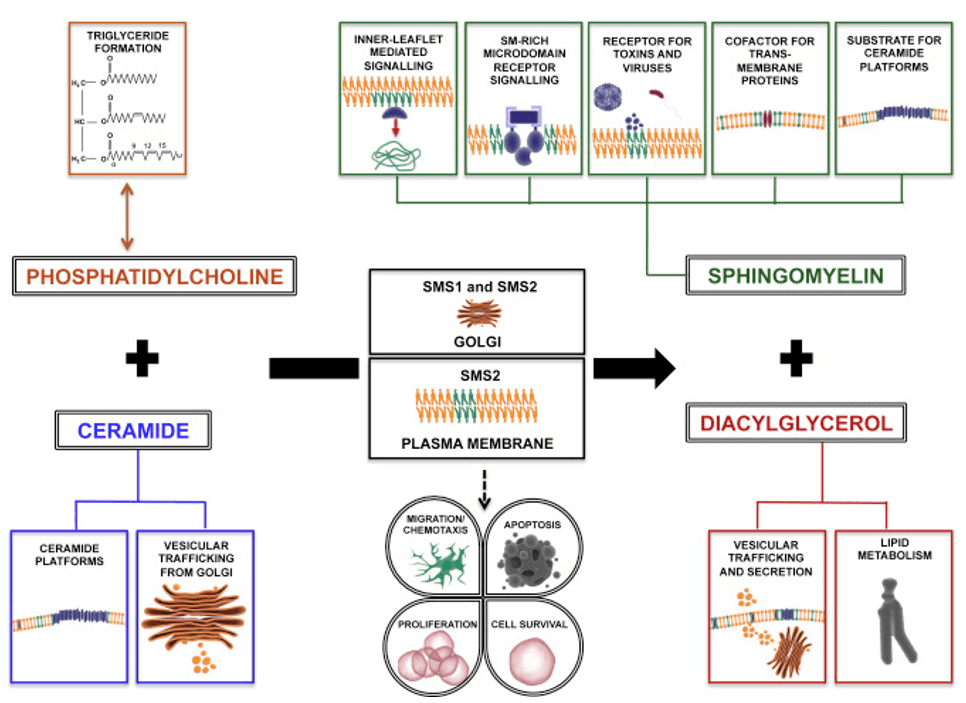
Sphingolipids are a complex class of bioactive lipids involved in membrane structure, cell signaling, apoptosis, inflammation, and immune response. They include ceramides, sphingomyelins, glycosphingolipids, and sphingosine-1-phosphate, each playing distinct roles in physiological and pathological processes.
Quantitative sphingolipid profiling is essential for understanding lipid metabolism, identifying disease-specific lipid alterations, and discovering biomarkers in cancer, neurodegeneration, metabolic syndromes, and inflammatory conditions. Accurate analysis supports mechanistic studies, therapeutic targeting, and translational research.

Targeted Sphingolipid Quantification
Absolute quantification of individual sphingolipids using class-specific internal standards and LC-MS/MS methods; ideal for biomarker validation.

Untargeted Sphingolipidomics Profiling
Global screening and relative quantification of known and novel sphingolipids using high-resolution UHPLC-QTOF-MS or Orbitrap platforms.

Sphingolipid Class Profiling
Focused analysis of specific lipid classes such as ceramides, sphingomyelins, or glycosphingolipids to investigate class-specific dysregulation.

Sphingolipid Metabolic Pathway Mapping
Analysis of key metabolites and intermediates in sphingolipid biosynthesis and degradation pathways (e.g., de novo pathway, salvage pathway, S1P pathway).

Isotope Tracer-Based Flux Analysis
Dynamic profiling of sphingolipid metabolic turnover using stable isotope-labeled precursors (e.g., 13C-palmitate, 15N-serine).

Comparative Lipidomics (Case-Control or Dose-Response)
Statistical comparison of sphingolipid profiles across experimental groups, drug treatments, or disease models.

Tissue-Specific Sphingolipid Distribution
Subcellular or tissue-specific profiling to reveal spatial heterogeneity (e.g., brain, liver, tumor, plasma, CSF).

Biomarker Discovery Services
Identification of differential sphingolipid signatures associated with pathological states using multivariate statistics and machine learning.

Custom Sphingolipid Panels
Tailor-made panels based on disease relevance, organism model, or analytical goals; ideal for translational research and companion diagnostics.
| Sphingolipid Class | Representative Detected Species | Associated Metabolites | Relevant Metabolic Pathways |
|---|---|---|---|
| Ceramides (Cer) | Cer(d18:1/16:0), Cer(d18:1/18:0), Cer(d18:1/20:0), Cer(d18:1/24:1), Cer(d18:1/24:0) | Dihydroceramides, Ceramide-1-phosphate, Inositolphosphoryl-ceramides | De novo synthesis, Ceramide salvage, Inflammatory signaling |
| Dihydroceramides (dhCer) | dhCer(d18:0/16:0), dhCer(d18:0/18:0), dhCer(d18:0/24:1) | Sphinganine | De novo ceramide biosynthesis |
| Sphingomyelins (SM) | SM(d18:1/16:0), SM(d18:1/18:1), SM(d18:1/24:0), SM(d18:1/24:1), SM(d18:1/20:0) | Ceramides, Choline | Sphingomyelin cycle, Membrane dynamics |
| Sphingosines & Derivatives | Sphingosine Base: Sphingosine (d18:1), Sphinganine (d18:0); Sphingosine-1-phosphate (S1P), Sphinganine-1-phosphate (Sa1P) | Phosphoethanolamine, NADPH | S1P signaling pathway, Ceramide breakdown |
| Ceramide-1-phosphate (C1P) | C1P(16:0), C1P(18:0), C1P(24:1) | Ceramides | Inflammation regulation, Cell survival |
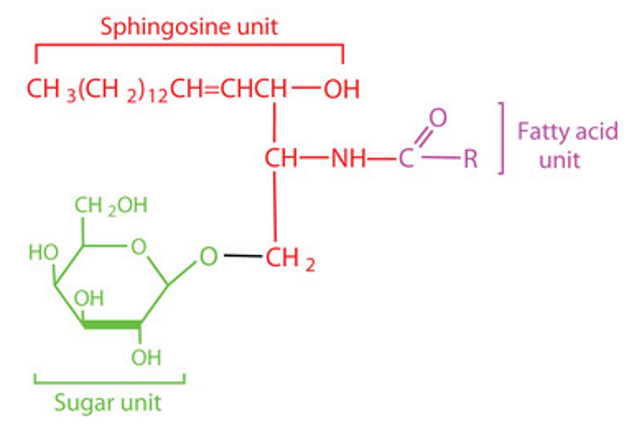
| Glycosphingolipids (GSLs) | Cerebrosides: Glucosylceramide (GlcCer), Galactosylceramide (GalCer); Dihexosylceramides (CerG2): Lactosylceramide (LacCer); Gb3, Gb4 | UDP-Glucose, UDP-Galactose | Glycosphingolipid biosynthesis, Lysosomal storage pathways |
| Globosides | Gb3, Gb4 | UDP-Galactose, UDP-N-acetylglucosamine | Blood group antigen synthesis, Glycosphingolipid signaling |
| Hexosylceramides (HexCer) | HexCer(d18:1/16:0), HexCer(d18:1/22:0), HexCer(d18:1/24:1) | Ceramides, Monosaccharides | Glycosylation pathway |
| Sulfatides (ST) | Sulfo-GalCer, ST(d18:1/24:1) | GalCer, PAPS (3'-phosphoadenosine-5'-phosphosulfate) | Myelin maintenance, Neurodegeneration pathways |
| Gangliosides | GM3, GM2, GM1, GD1a, GD3 | CMP-Neu5Ac, Lactosylceramide | Neuronal development, Ganglioside synthesis |
| Phytoceramides | PhytoCer(d18:0/24:0), PhytoCer(d18:0/20:0) | Phytosphingosine | Fungal sphingolipid metabolism (also relevant to plant models) |
| Sphingolipid Intermediates | 3-Ketosphinganine, Palmitoyl-CoA, Serine | - | De novo biosynthesis pathway initiation |
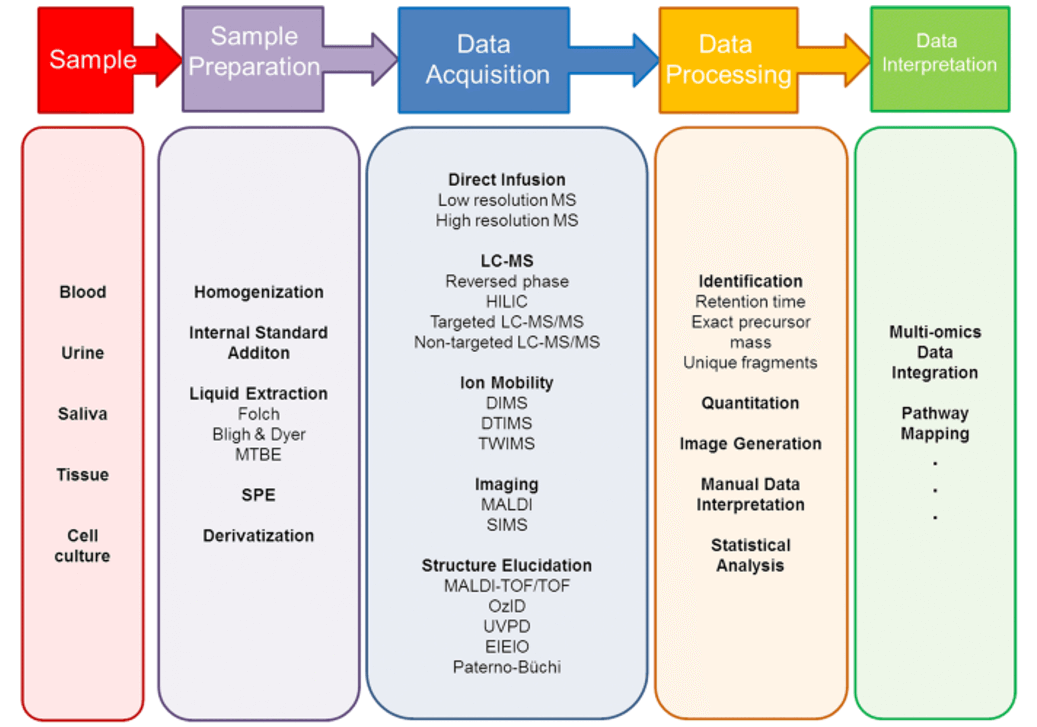
Triple Quadrupole LC-MS/MS
Targeted sphingolipid quantification with femtomolar sensitivity
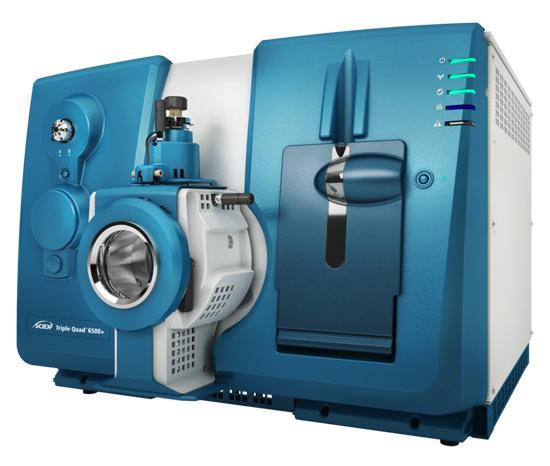
SCIEX Triple Quad™ 6500+ (Figure from Sciex)
Orbitrap MS
High-resolution profiling, isotope tracing
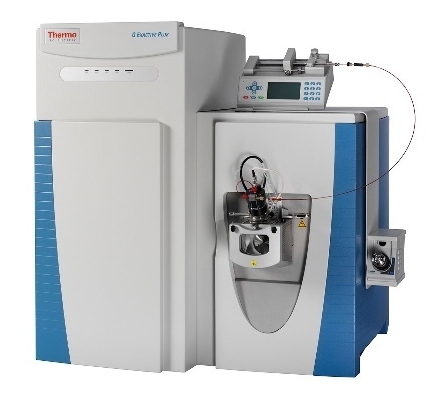
Thermo Fisher Q Exactive (Figure from Thermo Fisher)
UHPLC-QTOF-MS
Untargeted lipidomics and structural elucidation
Agilent 6545 Q-TOF(Figure from Agilent)
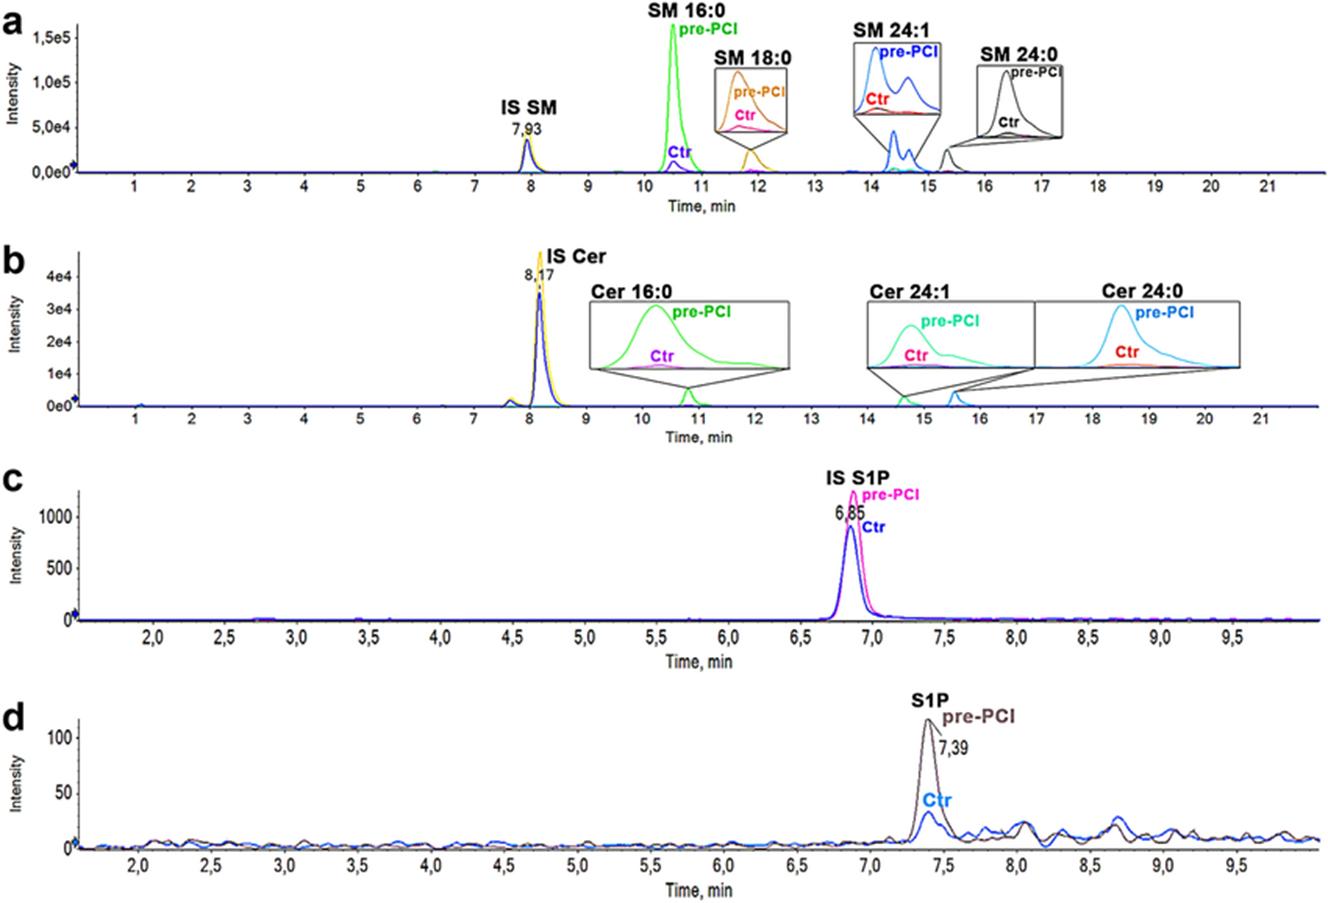
Sphingolipid chromatographic traces by LC–MS/MS (Burrello, J., et al., 2020).
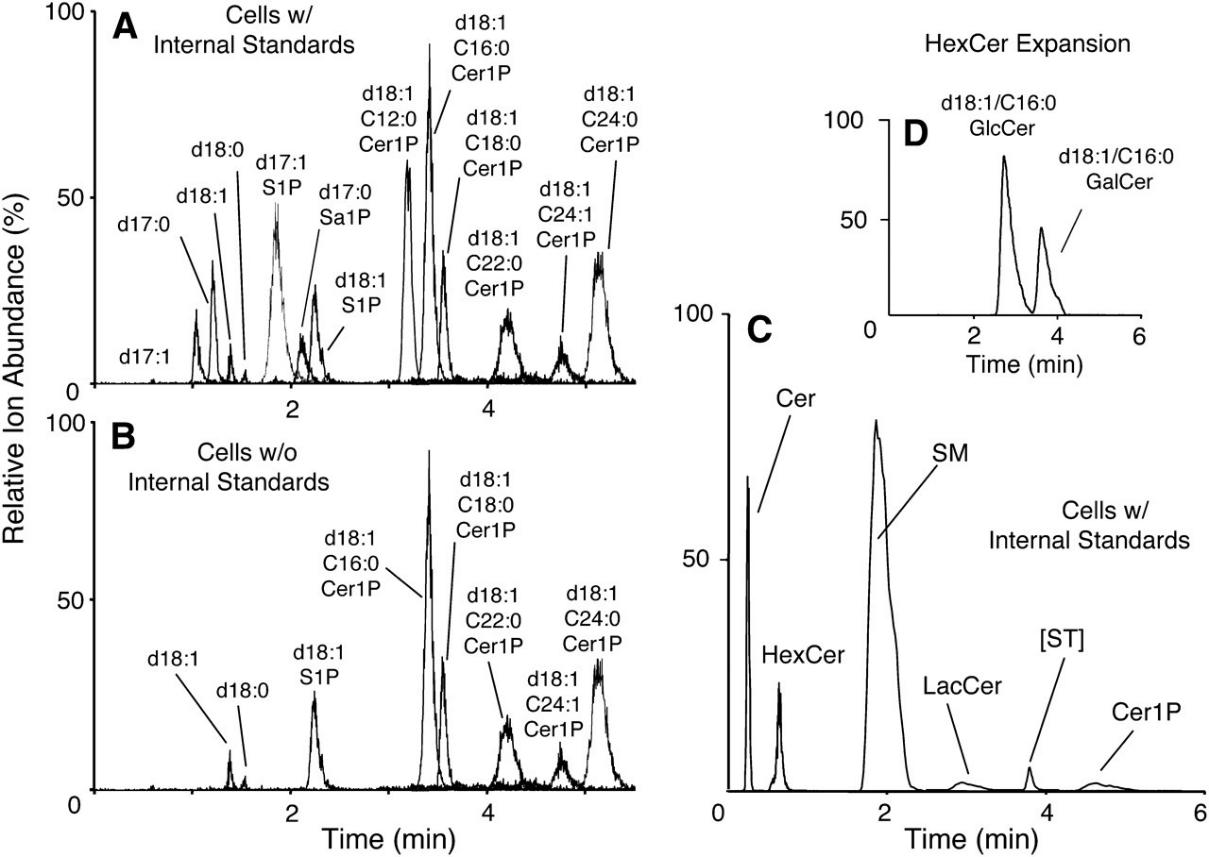
LC ESI-MS/MS elution profiles for the sphingolipids on reverse phase (A, B) and normal phase (C, D) chromatography (Shaner, Rebecca L., et al., 2009).
Explore our Lipidomics Solutions brochure to learn more about our comprehensive lipidomics analysis platform.


Metabolism and Obesity
Profiling lipid changes in metabolic disorders like obesity, diabetes, and insulin resistance.

Neurodegenerative Diseases
Analyzing serum lipids in Alzheimer's, Parkinson's, and other neurological disorders.

Inflammation and Immunity
Investigating lipid profiles in inflammation and immune response, relevant to autoimmune diseases.

Aging and Age-Related Diseases
Exploring lipidomic shifts linked to aging and related pathologies.

Toxicology and Environmental Exposure
Examining lipid metabolism changes due to environmental toxins and pollutants.

Nutritional Impact
Assessing how diet, fasting, and supplements affect lipid metabolism
| Sample Type | Recommended Amount |
|---|---|
| Plasma / Serum | ≥ 200 µL |
| Whole Blood | ≥ 500 µL |
| Tissue | ≥ 50 mg (wet weight) |
| Cells | ≥ 1 × 10⁷ cells or equivalent pellet |
| Cerebrospinal Fluid | ≥ 500 µL |
| Urine | ≥ 1 mL (preferably concentrated) |
| Feces | ≥ 100 mg (fresh or lyophilized) |
| Liver Microsomes | ≥ 200 µg protein |
| Lipid Extracts | ≥ 50 µg total lipids |
| Plant Tissues | ≥ 100 mg (fresh or flash-frozen) |
| Model Organisms (e.g. Drosophila, C. elegans) | ≥ 50 mg pooled sample |
How should I prepare biological samples before submission?
Can you differentiate between structural isomers (e.g., C16:0 vs. C18:0 ceramides)?
Yes. Our UPLC-MS/MS platform achieves baseline separation of isomers using optimized gradients (e.g., 0.1% formic acid in water/acetonitrile) with retention time shifts <0.1 min.
Do you support time-course or dose-response study designs?
Absolutely. We design batch analyses to minimize inter-run variability (CV <8%) and include QC samples at every 10th injection to ensure longitudinal data consistency.
How are low-abundance sphingolipids (e.g., S1P) stabilized during processing?
We add 10 mM EDTA and 0.1% butylated hydroxytoluene (BHT) during extraction to inhibit enzymatic degradation and oxidation.
Can I request analysis of oxidized or modified sphingolipids?
Yes. Our methods detect oxidized species (e.g., hydroxylated ceramides) and sulfatides using precursor ion scanning (PIS) and neutral loss modes.
How do you handle lipid identification for novel/uncharacterized sphingolipids?
Untargeted profiling via high-resolution MS (Orbitrap Exploris 480) with MS/MS spectral matching to databases (e.g., LIPID MAPS, HMDB). Putative structures are reported with m/z accuracy <3 ppm.
What if my samples have high background interference (e.g., serum with high triglycerides)?
We apply a two-phase liquid-liquid extraction (chloroform/methanol/water) to remove neutral lipids, achieving >95% purity for sphingolipid fractions.
How do you handle samples with high lipid diversity (e.g., plant or microbial sphingolipids)?
Our methods are optimized for cross-kingdom compatibility, including plant-specific sphingolipids (e.g., phytoceramides) and microbial species (e.g., inositol phosphorylceramide). We use high-resolution mass spectrometry (Orbitrap Exploris 480) with customized spectral libraries to ensure accurate identification .
Can I analyze sphingolipids in cell culture media or extracellular vesicles?
Yes. We provide protocols for extracellular vesicle (EV) isolation and analysis, ensuring minimal contamination from culture media lipids. Sensitivity is maintained at 0.5 pmol/mL for low-abundance species like S1P in EVs .
What bioinformatics tools do you use for pathway analysis?
We employ PathVisio and KEGG pathway mapping to visualize sphingolipid metabolism and integrate data with transcriptomic/proteomic datasets. Custom pathway overlays are included in reports .
Are your methods compatible with stable isotope tracing for flux analysis?
Yes. We support 13C- or 2H-labeled tracer studies to monitor sphingolipid turnover rates. Detection limits for labeled species are <1% natural abundance, enabling precise metabolic flux modeling .
Can you analyze sphingolipids in formalin-fixed paraffin-embedded (FFPE) tissues?
Yes. We apply lipid recovery protocols for FFPE samples, achieving >80% extraction efficiency for ceramides and sphingomyelins compared to fresh-frozen tissues .
How are data reported for untargeted sphingolipid discovery?
Untargeted results include m/z values, MS/MS spectra, and putative identifications (matched to LIPID MAPS/HMDB databases). Annotated spectra are provided with mass accuracy <3 ppm .
What is the impact of freeze-thaw cycles on sphingolipid stability?
Sphingolipids like S1P are sensitive to freeze-thaw cycles. We recommend ≤2 cycles for plasma/serum and use stabilization buffers (e.g., 10 mM EDTA) to minimize degradation .

References
Services:
Resource:
Platform:
Online Inquiry
CONTACT US