Targeted Quantification of Plant Lipid Classes
Accurate quantification of defined lipid classes including glycerolipids, phospholipids, sphingolipids, sterols, and glycolipids using MRM/PRM-based MS approaches.

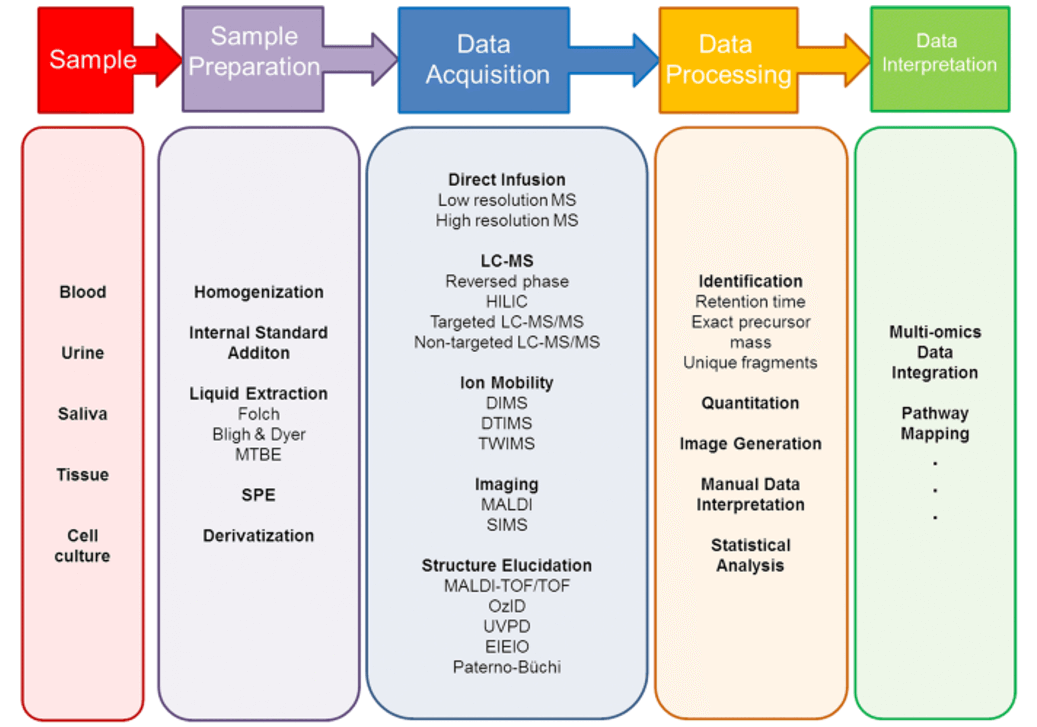
Creative Proteomics specializes in high-resolution plant lipidomics analysis, offering both targeted and untargeted lipid profiling services using advanced LC-MS/MS and GC-FID platforms. Our solutions help researchers accurately identify and quantify diverse lipid species, uncover metabolic pathways, and understand lipid-mediated responses to environmental stress, development stages, and genetic variation. With broad lipid coverage, high sensitivity, and pathway-integrated data interpretation, we empower plant science, agriculture, and biotechnology studies with actionable molecular insights.
Submit Your Request Now
×Our services have earned the trust of companies, schools, and organizations globally, and we remain dedicated to maintaining that trust.


Plant lipidomics is the comprehensive study of the lipid profile within plant cells, tissues, or organs, focusing on the identification, quantification, and functional analysis of lipid species and their associated metabolic pathways. It provides critical insights into membrane dynamics, energy storage, signal transduction, and plant responses to environmental stimuli.
Lipids are essential components of plant cells, influencing numerous biological processes such as membrane structure, signal transduction, and energy storage. A comprehensive analysis of plant lipidomics enables researchers to:
Lipidomic studies are indispensable for researchers seeking to explore plant physiology and improve agricultural practices through molecular-level insights.
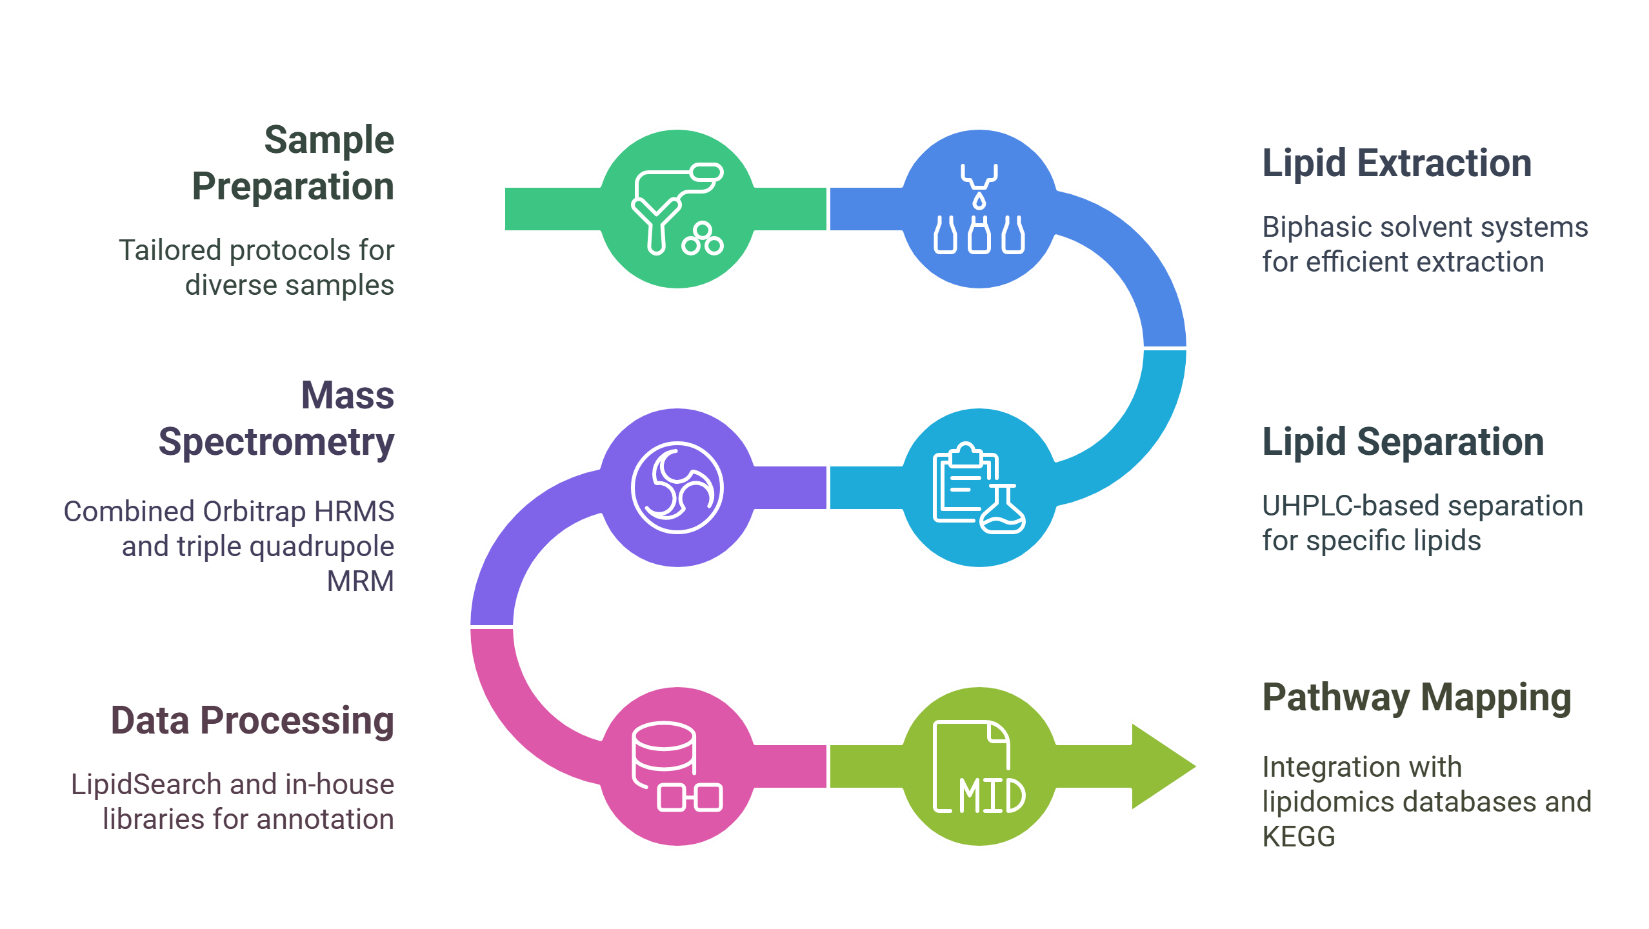
At Creative Proteomics, we provide an extensive portfolio of targeted lipidomics and untargeted lipidomics services to support comprehensive lipid profiling and metabolic research. Each service is designed to deliver high-resolution, quantitative insights into plant lipid metabolism, tailored to meet specific research and development goals across agricultural, food, and plant science sectors.

Targeted Quantification of Plant Lipid Classes
Accurate quantification of defined lipid classes including glycerolipids, phospholipids, sphingolipids, sterols, and glycolipids using MRM/PRM-based MS approaches.

Untargeted Plant Lipid Profiling
Discovery-driven profiling of hundreds of lipid species using high-resolution LC-MS/MS to uncover unknown or unexpected lipidomic shifts under various conditions.

Lipid Species Characterization at the Molecular Level
Structural elucidation of lipid molecules (e.g., acyl chain length, degree of unsaturation) through tandem MS fragmentation and accurate mass analysis.

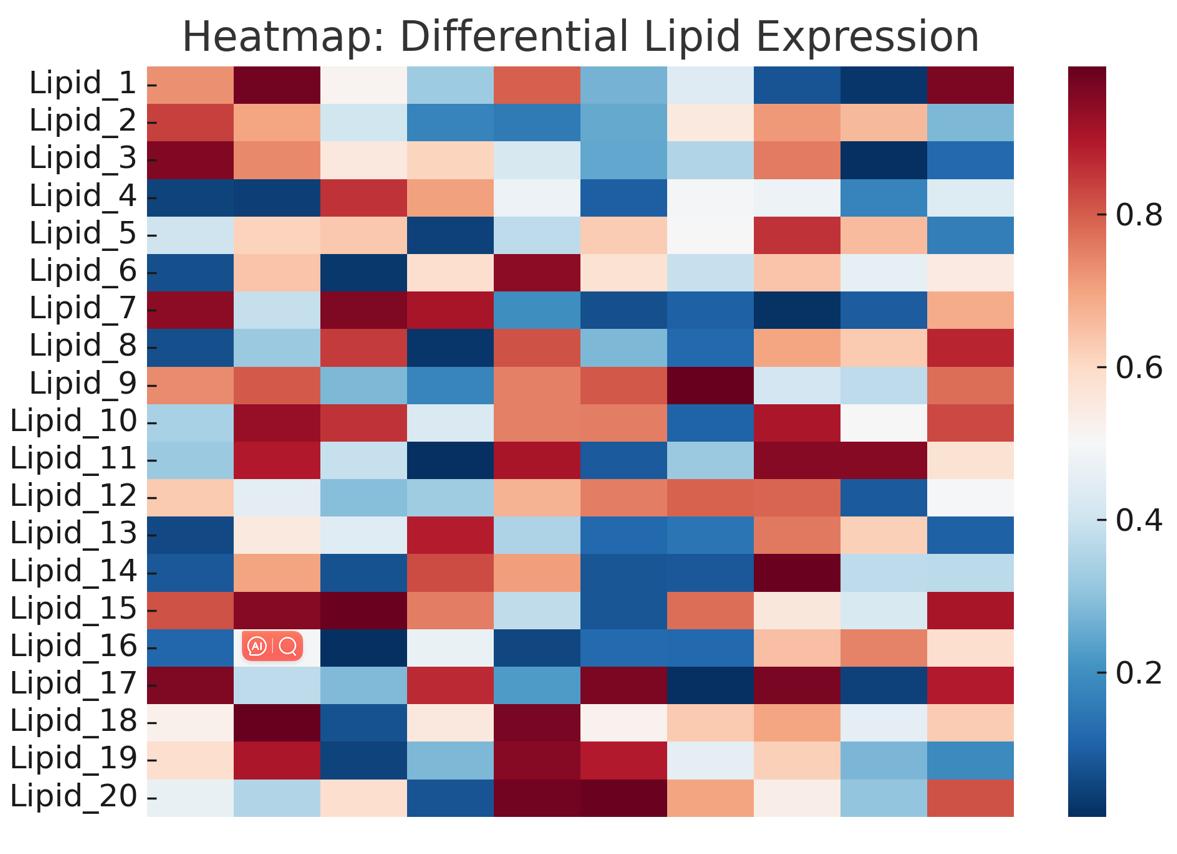
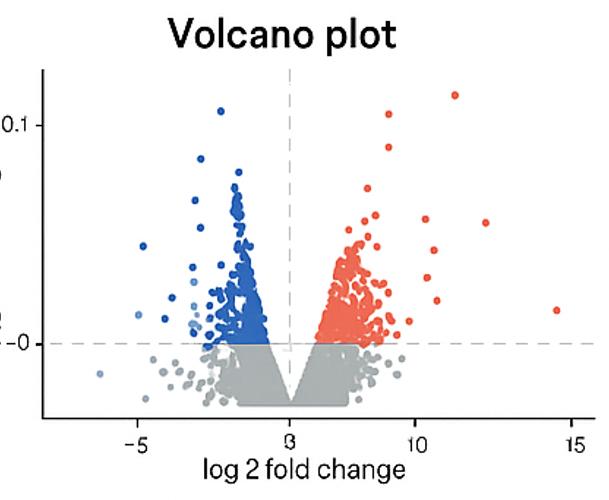
Differential Lipidomics Analysis
Comparative analysis of lipid profiles across treatment groups, genotypes, or environmental conditions to identify differentially accumulated lipid species.

Subcellular Lipidomics (Organ-Specific Lipid Mapping)
Lipid analysis in specific plant tissues or organelles (e.g., chloroplasts, mitochondria) for spatially resolved lipidomic information.

Plant Hormone-Linked Lipid Mediator Analysis
Detection and quantification of lipid-derived plant hormones such as jasmonates, abscisic acid (ABA), and oxylipins related to signaling pathways.

Pathway-Integrated Lipidomics & Metabolite Mapping
Integration of lipidomics data with KEGG/PlantCyc metabolic pathways to reveal the functional role of lipids in metabolic networks.

Stress-Responsive Lipid Biomarker Screening
Identification of lipid biomarkers associated with drought, salinity, heat, or pathogen resistance.

Time-Series Lipid Dynamics Analysis
Monitoring temporal changes in lipid metabolism during plant development, stress responses, or physiological transitions.

Custom Panel Design & Method Development
Tailored assay development for specific lipid classes or species of interest, including method validation and protocol optimization upon request.
To address diverse biological questions across plant systems, Creative Proteomics also provides organ- and compartment-specific lipidomics solutions:
| Lipid Class | Representative Species | Related Metabolites | Associated Pathways |
|---|---|---|---|
| Triacylglycerols (TAG) | TAG 52:2, TAG 54:6, TAG 48:0 | Glycerol-3-phosphate, Acyl-CoA | TAG biosynthesis, Energy storage |
| Diacylglycerols (DAG) | DAG 36:2, DAG 38:4 | Phosphatidic acid (PA) | Glycerolipid metabolism |
| Monoacylglycerols (MAG) | MAG 18:1, MAG 16:0 | Free fatty acids | Lipid hydrolysis, Signaling intermediates |
| Lipid Class | Representative Species | Related Metabolites | Associated Pathways |
|---|---|---|---|
| Phosphatidylcholine (PC) | PC 34:2, PC 36:6 | DAG | Membrane biogenesis, Signal transduction |
| Phosphatidylethanolamine (PE) | PE 36:2, PE 38:4 | CDP-ethanolamine, DAG | Glycerophospholipid metabolism |
| Phosphatidylinositol (PI) | PI 34:1, PI 36:2 | Inositol phosphate, DAG | PI signaling, Membrane trafficking |
| Phosphatidylserine (PS) | PS 34:2, PS 36:2 | Serine, CDP-diacylglycerol | Cell recognition, Membrane asymmetry |
| Phosphatidylglycerol (PG) | PG 34:1, PG 36:4 | Glycerol-3-phosphate | Chloroplast membrane structure |
| Phosphatidic Acid (PA) | PA 34:1, PA 36:3 | DAG, Acyl-CoA | Precursor for phospholipids & TAG synthesis |
| Lipid Class | Representative Species | Related Metabolites | Associated Pathways |
|---|---|---|---|
| Monogalactosyldiacylglycerol (MGDG) | MGDG 36:6, MGDG 34:3 | UDP-galactose | Thylakoid membrane biogenesis |
| Digalactosyldiacylglycerol (DGDG) | DGDG 36:6, DGDG 34:3 | UDP-galactose | Photosynthetic membrane remodeling |
| Sulfoquinovosyldiacylglycerol (SQDG) | SQDG 34:1, SQDG 36:2 | Sulfoquinovose, UDP-glucose | Sulfolipid biosynthesis, Stress adaptation |
| Lipid Class | Representative Species | Related Metabolites | Associated Pathways |
|---|---|---|---|
| Ceramides | Cer(d18:1/24:0), Cer(d18:0/16:0) | Sphinganine, Serine, Palmitoyl-CoA | Programmed cell death, Membrane signaling |
| Glycosylceramides | GluCer(d18:1/24:1), GalCer | Glucose, Galactose | Membrane structure in epidermal layers |
| Long-Chain Bases (LCBs) | d18:1, t18:0 | Sphingosine-1-phosphate | Signal transduction, Stress response |
| Lipid Class | Representative Species | Related Metabolites | Associated Pathways |
|---|---|---|---|
| Phytosterols | β-Sitosterol, Campesterol | Mevalonic acid, Squalene | Brassinosteroid biosynthesis |
| Sterol esters | β-Sitosterol ester, Stigmasterol ester | Acyl-CoA, Sterol precursors | Lipid storage, Membrane structure |
| Lipid Class | Representative Species | Related Metabolites | Associated Pathways |
|---|---|---|---|
| Saturated FAs | Palmitic acid (C16:0), Stearic acid | Acetyl-CoA, Malonyl-CoA | Fatty acid biosynthesis |
| Unsaturated FAs | Linoleic acid (C18:2), ALA (C18:3) | Fatty acyl-ACP | Desaturation pathways, Lipid remodeling |
| Lipid Class | Representative Species | Related Metabolites | Associated Pathways |
|---|---|---|---|
| Jasmonates | Jasmonic acid, OPDA | 13-HPOT, Linolenic acid | Oxylipin biosynthesis, Defense response |
| Hydroxy fatty acids | 9-HODE, 13-HODE | Lipid peroxides | Lipoxygenase (LOX) pathway |
| Epoxy & Keto derivatives | 12,13-EpOME, 12-KOPDA | FA hydroperoxides | Oxidative stress signaling |
| Lipid Class | Representative Species | Related Metabolites | Associated Pathways |
|---|---|---|---|
| LPC (Lyso-PC) | LPC 16:0, LPC 18:1 | Choline | Lipid remodeling, Signal transduction |
| LPE (Lyso-PE) | LPE 18:2, LPE 16:0 | Ethanolamine | Phospholipid degradation |
| LPI, LPS, LPG, LPA | LPA 18:1, LPI 18:2 | Inositol, Glycerol-3-phosphate | Lysophospholipid signaling |
| Lipid Class | Representative Species | Related Metabolites | Associated Pathways |
|---|---|---|---|
| Tocopherols (Vitamin E) | α-Tocopherol, γ-Tocopherol | Homogentisic acid, Phytyl-PP | Antioxidant metabolism |
| Carotenoids | β-Carotene, Lutein, Violaxanthin | Isopentenyl pyrophosphate (IPP) | Pigment biosynthesis, Photoprotection |
| Phylloquinone (Vitamin K1) | K1 | Menadione, Menaquinone | Electron transport in photosystem I |
High-Resolution LC-MS/MS
Enables broad-spectrum, untargeted lipidome profiling with sub-ppm mass accuracy.
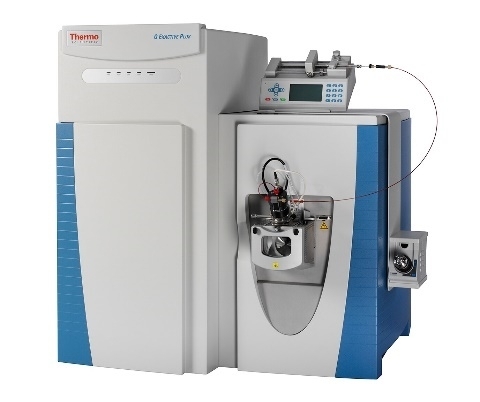
Thermo Fisher Q Exactive (Orbitrap LC-MS/MS) (Figure from Thermo Fisher)
Targeted LC-MS/MS
Supports high-sensitivity quantification of specific lipid classes via MRM mode.
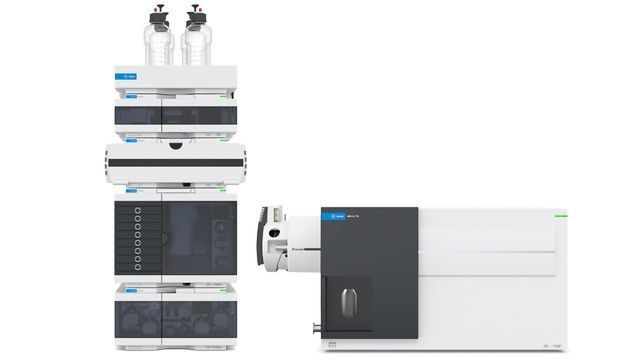
Agilent 6495C + 1260 HPLC (Figure from Agilent)
GC-MS
Used for fatty acid methyl esters (FAMEs), sterols, and volatile lipid compound identification.
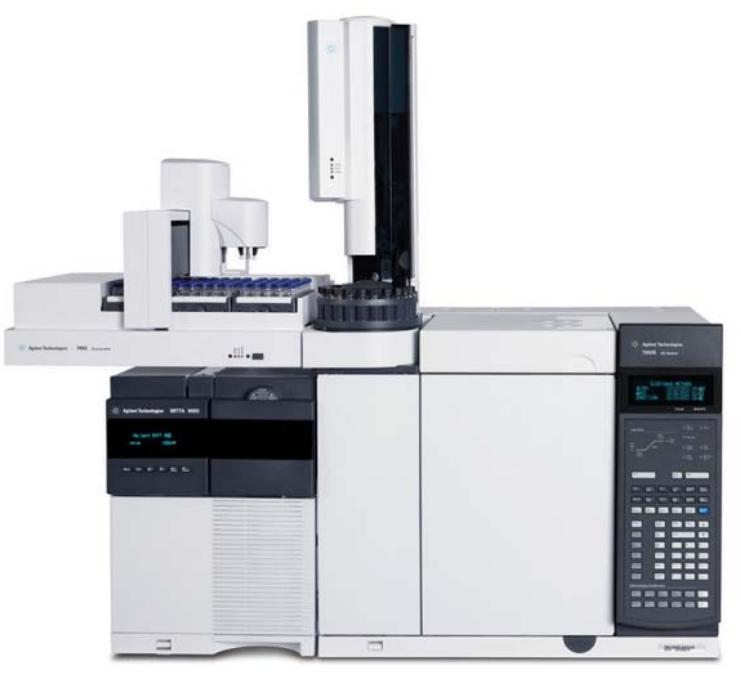
Agilent 7890B + 5977A MSD (Figure from Agilent)
GC-FID
Classical platform for high-precision quantification of total fatty acids in plant tissues.
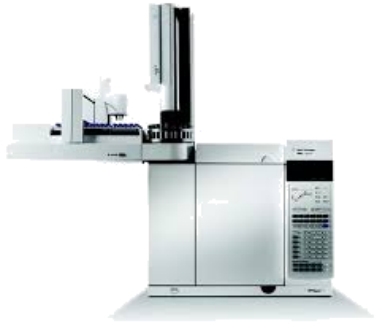
Agilent 7890A (Figure from Agilent)
Explore our Lipidomics Solutions brochure to learn more about our comprehensive lipidomics analysis platform.

| Sample Type | Required Amount (Fresh Weight) | Storage Condition | Notes |
|---|---|---|---|
| Fresh plant tissue (leaves, roots, stems) | ≥ 200 mg | -80°C (snap frozen in liquid N₂) | Avoid repeated freeze-thaw; remove excess moisture before freezing |
| Lyophilized plant tissue | ≥ 50 mg | -20°C | Record lyophilization details and moisture content |
| Seeds (e.g., Arabidopsis, soybean) | ≥ 100 mg | -80°C | Homogenize prior to extraction recommended |
| Plant cell suspension cultures | ≥ 1 × 10⁷ cells | -80°C or in extraction buffer | Collect via centrifugation, wash, and freeze immediately |
| Algae or aquatic plant biomass | ≥ 200 mg wet weight | -80°C | Filtered and frozen promptly after harvest |
| Extracted lipid samples (optional) | ≥ 100 µL (concentration ≥1 mg/mL) | -20°C in organic solvent | Must specify extraction protocol, solvent composition |
| Sample Type | Required Amount (Fresh Weight) | Storage Condition | Notes |
| Lyophilized plant tissue | ≥ 50 mg | -20°C | Record lyophilization details and moisture content |

Agricultural Research
Studying lipid composition to improve plant stress tolerance and enhance yield.

Plant Metabolism Studies
Understanding lipid metabolic pathways and their role in plant growth and development.

Environmental Science
Analyzing the effect of environmental stressors on plant lipid metabolism.

Plant Breeding
Identifying lipid biomarkers associated with desirable traits in crops.

Food Science
Investigating lipid profiles in plants for better nutritional content and quality control.

Biotechnology
Developing genetically modified plants with optimized lipid content for industrial applications.
What is the typical turnaround time for a plant lipidomics project?
Turnaround time depends on project complexity and sample volume, but standard delivery is 3–5 weeks from sample receipt.
Can you help with experimental design or sample selection?
Yes. Our scientific team offers consultation on experimental design, including sampling strategies, replicates, and control setup to ensure meaningful lipidomics results.
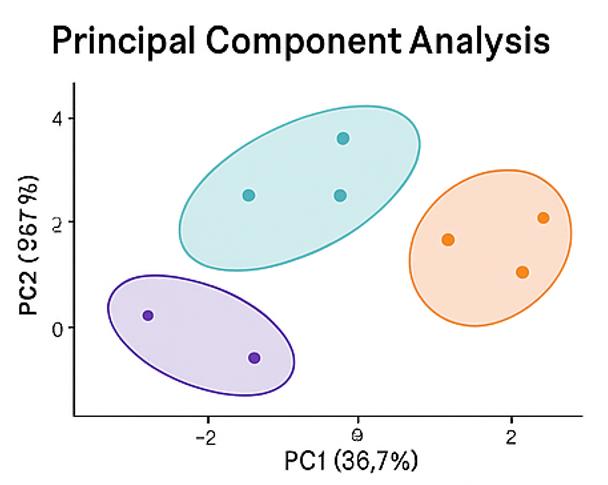
Do you provide statistical analysis and interpretation?
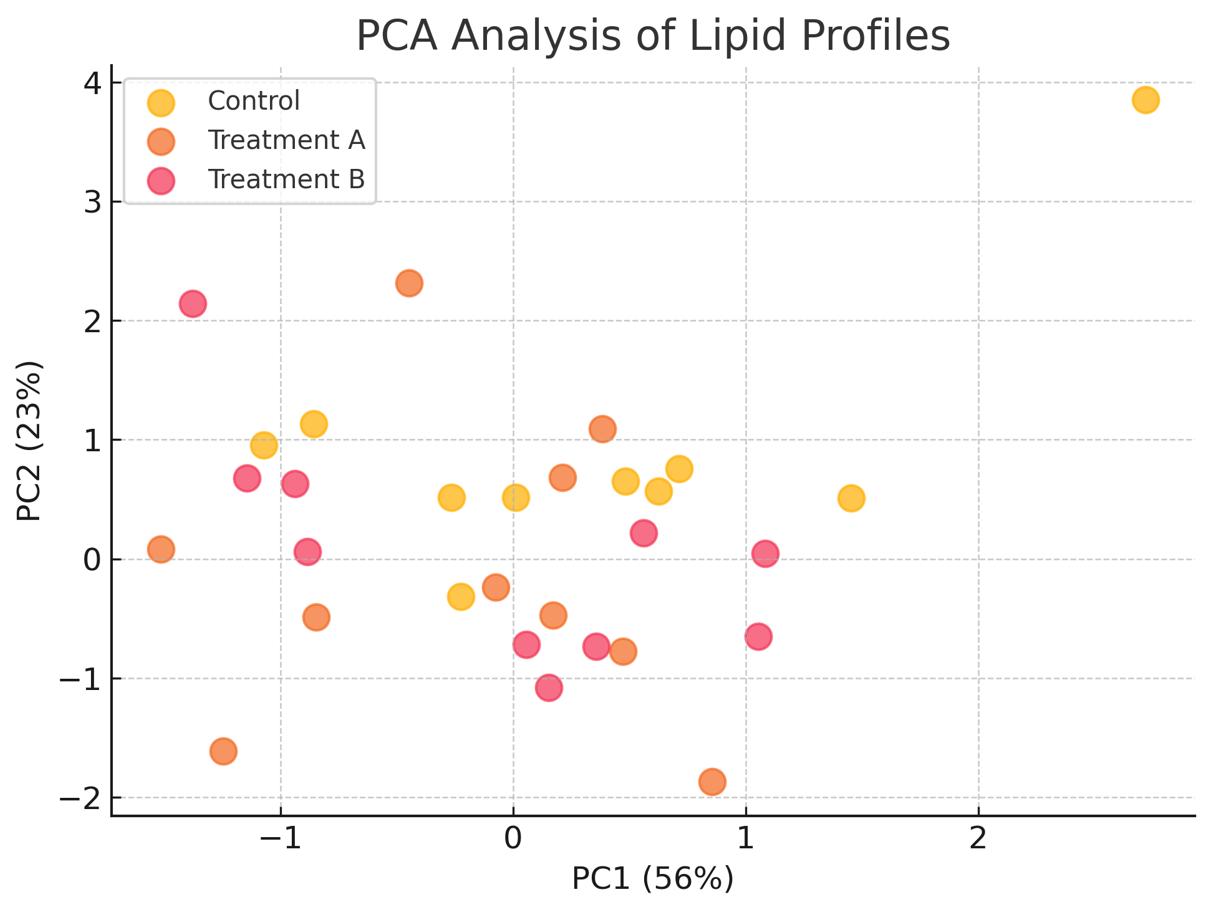
Yes. In addition to raw and processed data, we deliver multivariate statistical analysis (e.g., PCA, PLS-DA), fold change, p-value filtering, and lipid pathway mapping.
How do I know if my sample quality is sufficient?
We offer pre-analysis consultation and quality control checks upon sample arrival. Samples failing QC will be flagged before analysis begins.
What is the minimum number of replicates recommended?
We recommend at least three biological replicates per condition to ensure robust statistical analysis and reproducibility.
Is custom lipid panel design available?
Absolutely. We can develop targeted panels for specific lipid classes, metabolic pathways, or species of interest upon request.
Can you work with rare or low-yield plant samples?
Yes. Thanks to our ultra-sensitive platforms (down to 10–50 fmol detection limits), we can analyze lipid profiles from minimal biomass, such as single leaves or rare tissues.
What organisms or species can you support?
We support a broad range of plant species, including model plants (e.g., Arabidopsis, rice), crops (e.g., maize, soybean), and wild species. Species-specific lipid databases can be applied if available.
How do you ensure data reproducibility across runs?
We use internal standards, pooled QC samples, and rigorous batch normalization procedures to maintain intra- and inter-batch CVs below 10%.

References
Services:
Resource:
Platform:
Online Inquiry
CONTACT US