
Choose relative lipid quantification when the goal is to compare lipid abundance across samples within one controlled study. Choose absolute quantification when the result must be reported in concentration units for predefined lipids and supported by calibrators, internal standards, and matrix-specific method performance.
Absolute is not automatically better than relative. It answers a different question and requires a narrower, more thoroughly characterized assay. Many projects benefit from a staged design: use broad relative profiling to discover relevant lipids, then apply targeted absolute quantification to a focused validation panel.
Lipid Quantification Strategy at a Glance
- Relative quantification: Compares normalized signal for the same lipid across samples; best for discovery, group differences, pathway patterns, and prioritization.
- Semiquantification: Estimates abundance using a class-matched or surrogate standard; useful when authentic standards are unavailable, but results should not be presented as analyte-specific absolute concentrations.
- Absolute quantification: Converts analyte response into concentration or amount using a defined calibration model and suitable standards; best for prespecified quantitative endpoints.
- Internal standards: Correct technical variation but do not, by themselves, create absolute quantification without an appropriate quantitative model.
- Matrix and units: Calibration, recovery, ion suppression, sample loading, and reporting units must match the specimen and study question.
- Hybrid design: Untargeted relative profiling followed by targeted absolute measurement often balances coverage and quantitative confidence.
What Is Relative Lipid Quantification?
Relative quantification reports how the signal for a lipid changes across samples or groups. The output may be normalized peak area, analyte-to-internal-standard response, fold change, log2 fold change, or another within-study abundance scale.
The key comparison is the same lipid measured under the same analytical workflow. A twofold increase in normalized PC 34:1 signal indicates a higher response for PC 34:1 in one group than another. It does not mean that PC 34:1 is twice as abundant as a different lipid with a peak area half as large.
Different lipid structures produce different extraction recoveries and ionization responses. Chain length, unsaturation, headgroup, adduct, concentration, coeluting matrix, and source conditions can all change signal intensity. For this reason, raw peak areas should not be compared across unrelated lipid species as if they were molar amounts (Wang et al., 2017; Alseekh et al., 2021).
When relative quantification is scientifically sufficient
Relative results are often appropriate when a study asks:
- Which lipid species differ between two experimental groups?
- Which lipid classes or pathways respond to a perturbation?
- Which features should be prioritized for targeted validation?
- Do samples cluster by treatment, genotype, tissue, or time point?
- Does the direction of a lipid change replicate in an independent cohort?
Untargeted studies frequently measure hundreds or thousands of lipid features for these questions. Smirnov et al. noted that relative abundance differences are sufficient for many discovery designs because the goal is to identify reproducible changes, not to assign molar concentration to every detected feature (Smirnov et al., 2021).
Creative Proteomics' untargeted lipidomics service supports broad profiling, lipid annotation, normalized abundance comparison, and multivariate analysis. The study should still include internal standards, pooled QCs, blanks, and balanced batch design; relative does not mean uncontrolled.
What relative results cannot support
Relative data generally cannot establish that a sample contains an analyte at a specified ng/mL, nmol/g, or pmol/10^6 cells. It also cannot automatically support direct comparison with concentration values from another laboratory, platform, extraction method, or matrix.
Fold change is context dependent. A twofold change near the reporting limit may be less reliable than a 20% change in a strong, stable signal. Interpretation should include signal quality, missingness, QC variability, blank contribution, structural identification level, and biological replication.
What Is Absolute Lipid Quantification?
Absolute quantification estimates the amount or concentration of a defined lipid using a calibrated relationship between analyte response and known quantity. Common outputs include ng/mL biofluid, nmol/g tissue, pmol/mg protein, or amount per specified cell count.
In LC-MS/MS, the response is often an analyte-to-internal-standard peak-area ratio evaluated against a multipoint calibration curve. The calibrators define the working range, while the internal standard helps control preparation and instrument variation. Matrix-specific accuracy, precision, recovery, selectivity, carryover, stability, and dilution behavior determine whether the result is fit for the stated purpose.
Absolute concentration requires more than an internal standard
An isotope-labeled standard added at a known amount can improve measurement, but its presence alone does not prove absolute quantification. The assay also needs a defensible calibration approach, confirmed response range, supported analyte identity, and reporting unit tied to the original sample.
One-point calibration or class-based response factors may provide useful estimates in some lipidomics workflows. These results should be described accurately as estimated concentration or semiquantification unless analyte-specific performance supports a stronger claim.
Jung et al. combined external multipoint calibration and internal one-point calibration using ^13C-labeled lipid standards, illustrating how broader quantitative coverage can be expanded while retaining explicit performance filters (Jung et al., 2021). The method design, not the word “absolute,” establishes credibility.
When absolute quantification is needed
Absolute results are appropriate when a study requires:
- A prespecified concentration endpoint for named lipids.
- Comparison with an established concentration range or external dataset using compatible methods.
- Concentration-response or time-course modeling in physical units.
- Mass balance, pathway pool size, or stoichiometric interpretation.
- Transfer of a focused lipid panel across cohorts, sites, or future studies.
- Quantitative confirmation of candidates discovered by untargeted profiling.
The targeted lipidomics service is the natural route when analytes are predefined and concentration-level reporting is required. Panel feasibility depends on standard availability, expected range, matrix, sample amount, structural specificity, and the number of analytes.
Relative, Semiquantitative, and Absolute Lipid Results Compared
| Decision factor | Relative quantification | Semiquantification | Absolute quantification |
|---|---|---|---|
| Primary output | Normalized signal or fold change | Estimated amount using surrogate response | Concentration or amount in stated units |
| Typical scope | Broad, often hundreds to thousands of features | Intermediate coverage by class | Focused, predefined analyte panel |
| Calibration | Not required for every feature | Class or surrogate calibration may be used | Defined calibration model for reported analytes |
| Internal standards | Class-aware panel recommended | Class-matched or surrogate standards | Matched labeled standards preferred when available |
| Cross-study comparability | Limited without shared references and methods | Moderate and method dependent | Stronger when methods, units, and matrices are harmonized |
| Best use | Discovery and within-study comparisons | Prioritization or approximate pool assessment | Validation and concentration-based endpoints |
| Main risk | Treating signal as concentration | Overstating estimated values as exact | Narrow coverage or unsupported analyte claims |
If the scientific conclusion is based on direction and fold change within one controlled experiment, relative quantification is usually sufficient. If it depends on a concentration threshold, physical pool size, or transferable numeric value, select absolute quantification for the required analytes.
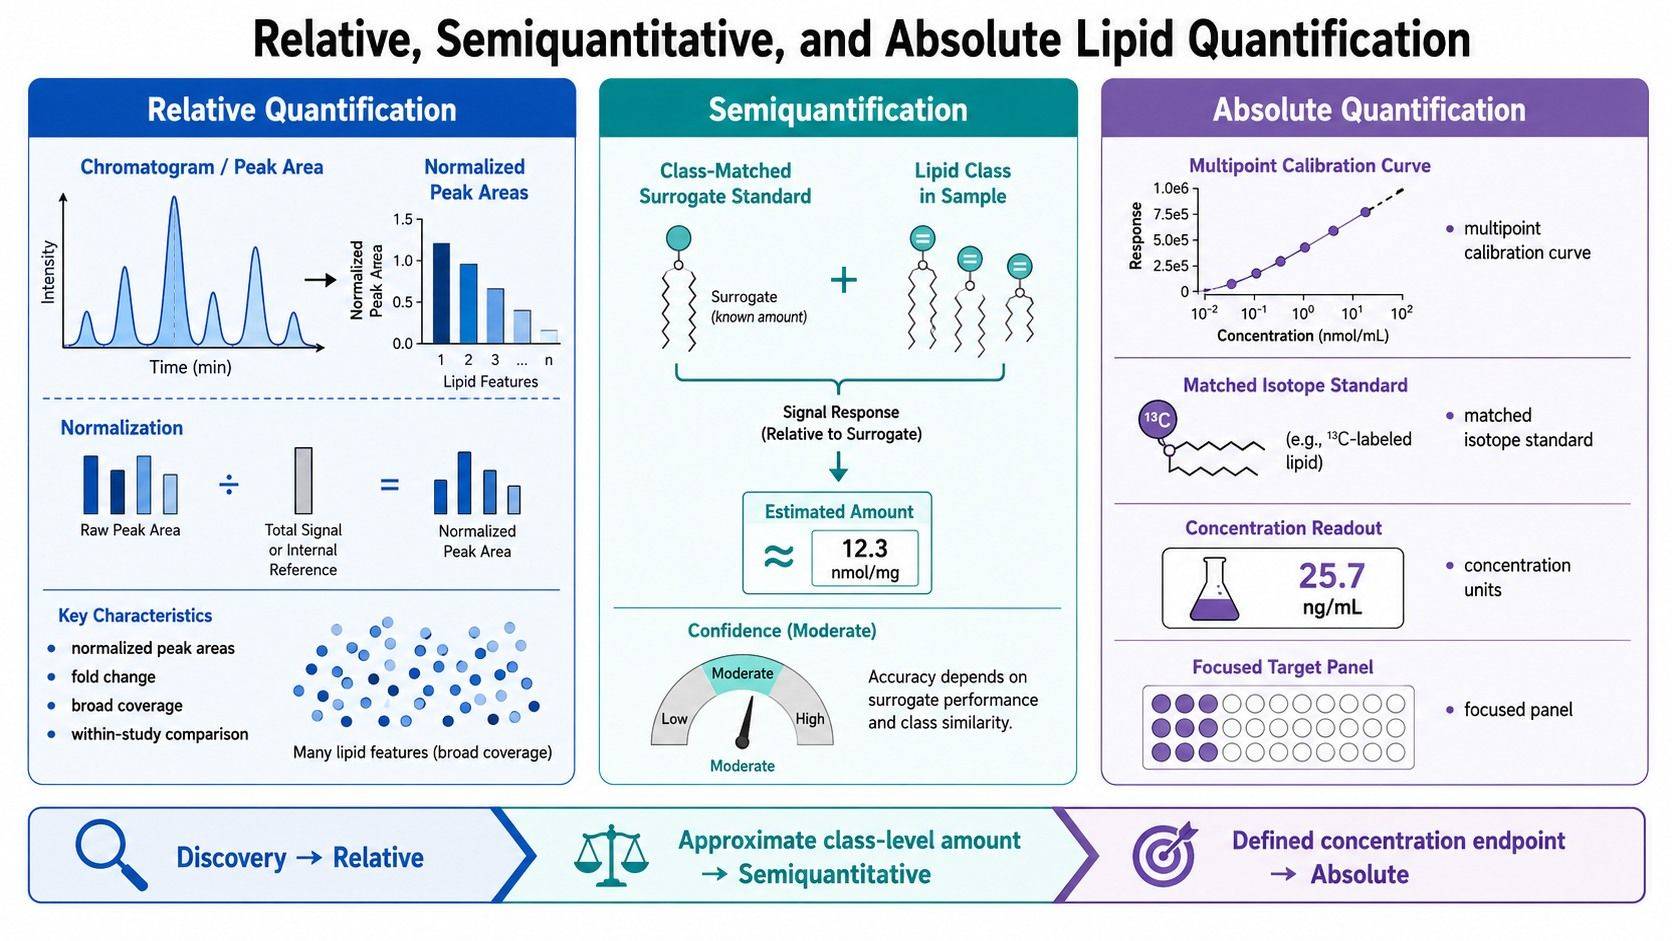 Relative, semiquantitative, and absolute lipid quantification support different study endpoints.
How Standards and Calibration Affect Lipid Quantification
The ideal internal standard is chemically identical to the analyte except for an isotope label. It coextracts and coelutes with the analyte while remaining distinguishable by mass. Such standards can compensate for loss, matrix suppression, and response variation more effectively than a distant structural analog.
Matched labeled standards are not available for every lipid. Broad lipidomics therefore uses panels that represent classes or structural ranges. The limitation is important: one standard may not model every chain length, unsaturation state, adduct, or retention region equally (Wang et al., 2017).
Calibration curve design
A multipoint curve should span the expected sample range without relying on extrapolation. The response model, weighting, lower and upper reporting limits, back-calculated calibrator performance, and QC levels should be defined before study samples are interpreted.
Endogenous lipids complicate calibration because a truly blank biological matrix may not exist. Options include surrogate matrix, background subtraction, standard addition, stripped matrix, or another validated strategy. Each approach has assumptions and should be qualified for the matrix and analyte panel.
Standard addition and surrogate matrices
Standard addition can account for matrix effects by adding known analyte quantities directly to the sample matrix. It is useful for difficult endogenous analytes but increases analytical burden and may be impractical for large panels or cohorts.
A surrogate matrix avoids endogenous background but may not reproduce extraction recovery and ion suppression of the real sample. Quality controls prepared in authentic matrix can help evaluate the gap. The final report should state the calibration basis so users understand how concentrations were derived.
Response factors are not universal
Even within a lipid class, response may vary with fatty-acyl composition and concentration. Khoury et al. described absolute lipid quantification as a compromise among analytical coverage, standard availability, detector response, and structural diversity (Khoury et al., 2018).
If standards cover only selected members of a class, report those analytes as validated concentrations and describe the remaining species as estimates or relative abundances. Mixing these evidence levels in one unlabeled “concentration” column creates false precision.
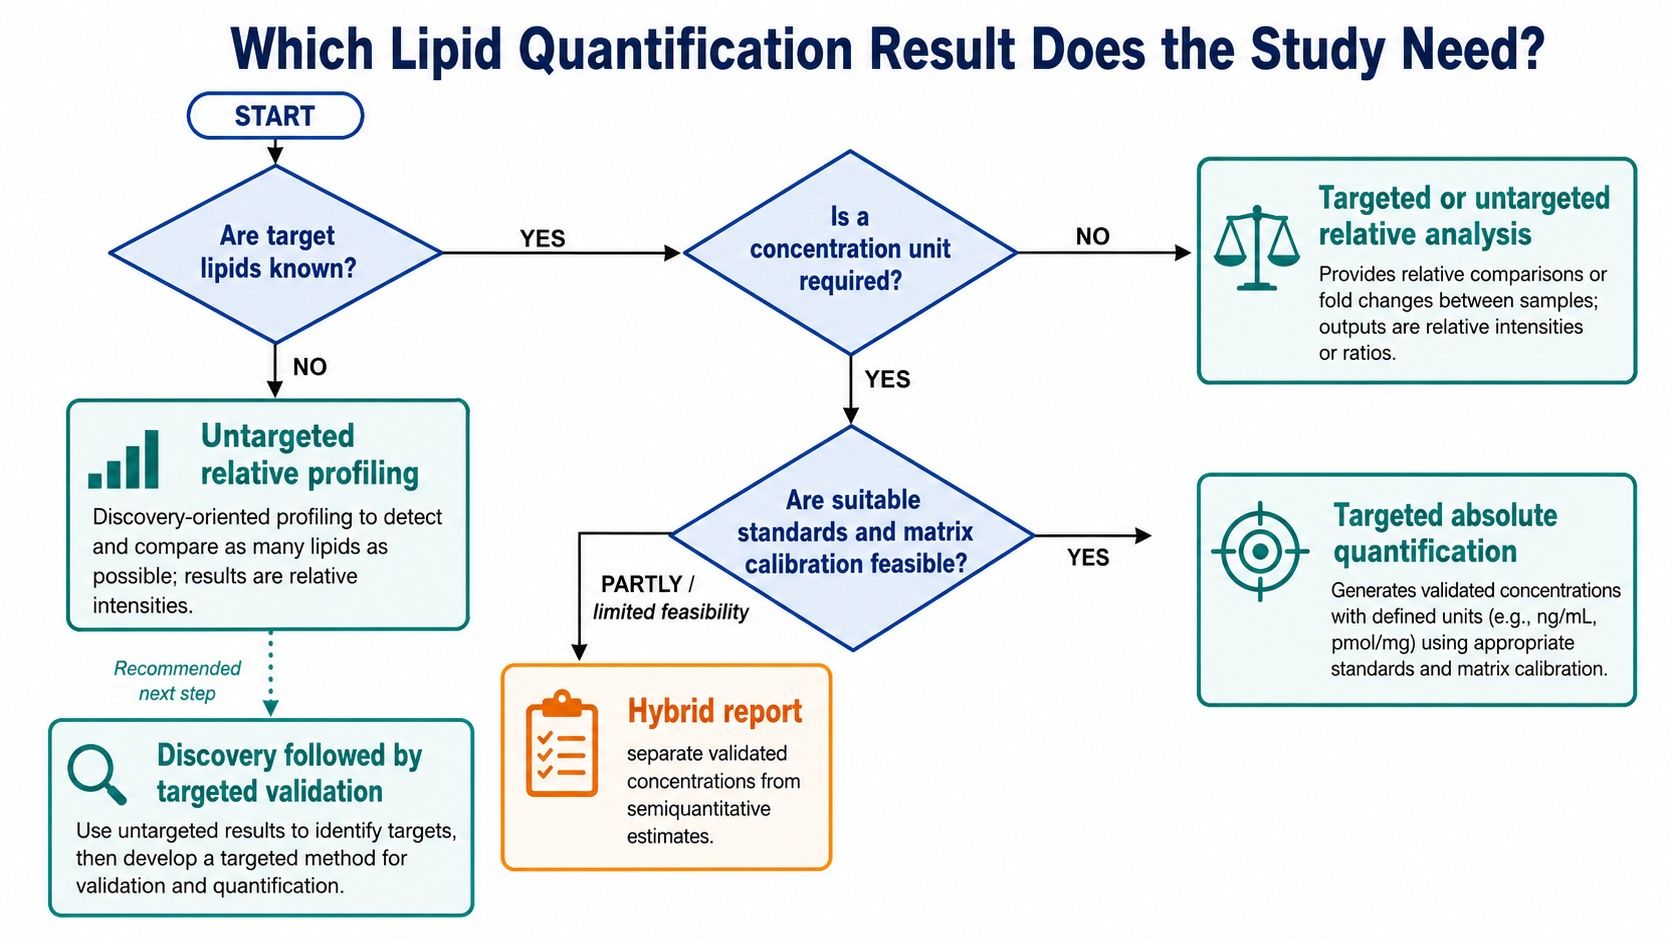 Absolute lipid quantification depends on calibration range, internal standards, and matrix QC evidence.
How Matrix and Normalization Change the Meaning of the Result
The concentration unit must represent the biological denominator. Biofluids may use volume; tissue may use wet weight, protein, DNA, or another loading measure; cell studies may use cell count, protein, or DNA. These denominators answer different questions.
A result of 20 pmol/mg protein is not directly interchangeable with 20 pmol/g wet tissue. A fold change from normalized peak area is not directly interchangeable with either value. The project should prespecify the primary unit and any secondary normalization before group labels are unblinded.
Matrix effects can differ between study groups
Ion suppression is caused by coeluting components that affect analyte ionization. If matrix composition differs substantially across groups, a standard curve in solvent may not describe sample response. A matched isotope standard can reduce this problem for its analyte, but class-surrogate standards may not fully correct every feature.
Recovery experiments, dilution series, post-extraction spikes, and matrix QC samples can help determine whether the response is proportional and comparable. Alseekh et al. emphasized that calibration, recovery, ion suppression, randomization, and reporting basis are linked components of quantitative MS studies (Alseekh et al., 2021).
Normalization does not convert relative data into absolute data
Total signal normalization, probabilistic quotient normalization, median scaling, and QC-based drift correction can improve within-study comparability. They do not create a physical concentration scale. Similarly, dividing by protein or cell count provides a biological denominator but does not replace calibration.
For guidance on result tables, multivariate plots, and annotation confidence, refer to the resource on how to interpret lipidomics data. Projects requiring custom normalization, group comparison, or covariate modeling can also incorporate lipidomics bioinformation analysis. Quantification type should be checked before any biological conclusion is attached to a numeric column.
Should You Choose Targeted or Untargeted Lipidomics?
Targeted versus untargeted and absolute versus relative are related decisions, but they are not perfect synonyms. Untargeted methods are commonly relative or semiquantitative, while targeted assays commonly support absolute quantification. Hybrid workflows can blur this boundary.
Choose untargeted relative profiling for discovery
Untargeted LC-HRMS is appropriate when the relevant lipid species are not known in advance or when broad pathway coverage is central. It can reveal coordinated changes across glycerophospholipids, sphingolipids, glycerolipids, sterols, and other classes.
The tradeoff is that not every feature has an authentic standard, full structural resolution, or analyte-specific calibration. Results should be reported at the supported identification level and used to prioritize reproducible biological patterns.
Choose targeted absolute quantification for predefined endpoints
Targeted LC-MS/MS is appropriate when named lipid species, expected ranges, and required units are known. Multiple reaction monitoring or other focused acquisition can allocate analytical capacity to selected compounds and support calibrators, QC levels, and interference checks.
Targeted does not guarantee absolute accuracy. Standards, calibration, matrix validation, and structural selectivity remain necessary. A targeted panel without suitable reference materials may still be relative or semiquantitative. For membrane-lipid questions, a class-focused phospholipid analysis strategy can be scoped around the required species and quantitative evidence.
Use a staged discovery-to-validation design
A common design begins with untargeted relative profiling in a representative discovery set. Lipids are prioritized based on effect size, QC performance, identification confidence, biological relevance, and replication. A targeted assay then measures the smaller panel with stronger quantitative evidence in the full or independent cohort.
This sequence avoids building expensive calibration around uninformative targets while preventing discovery-stage peak areas from being overstated as definitive concentrations. The existing comparison of untargeted and targeted lipidomics provides broader platform context; the present decision centers specifically on the result scale.
Lipid Quantification Decision Framework
Use these questions in order:
- Is the primary endpoint a within-study difference or a physical concentration?
- Are the target lipid species known before analysis?
- Is broad class coverage more important than analyte-specific calibration?
- Are authentic and isotope-labeled standards available for the required targets?
- Is the matrix endogenous background compatible with the proposed calibration strategy?
- What unit will answer the biological question: per volume, mass, protein, DNA, or cell count?
- Must values be compared across studies, laboratories, sites, or future batches?
- What structural level is required: class, sum composition, acyl chains, sn-position, or double-bond location?
- Which QC evidence will support the reported result type?
- Would a discovery phase reduce uncertainty before targeted panel development?
If the targets are unknown and the objective is pathway discovery, choose untargeted relative profiling. If targets and units are defined and standards are available, choose targeted absolute quantification. If only some standards exist, use a mixed report that clearly separates validated concentrations from semiquantitative or relative results.
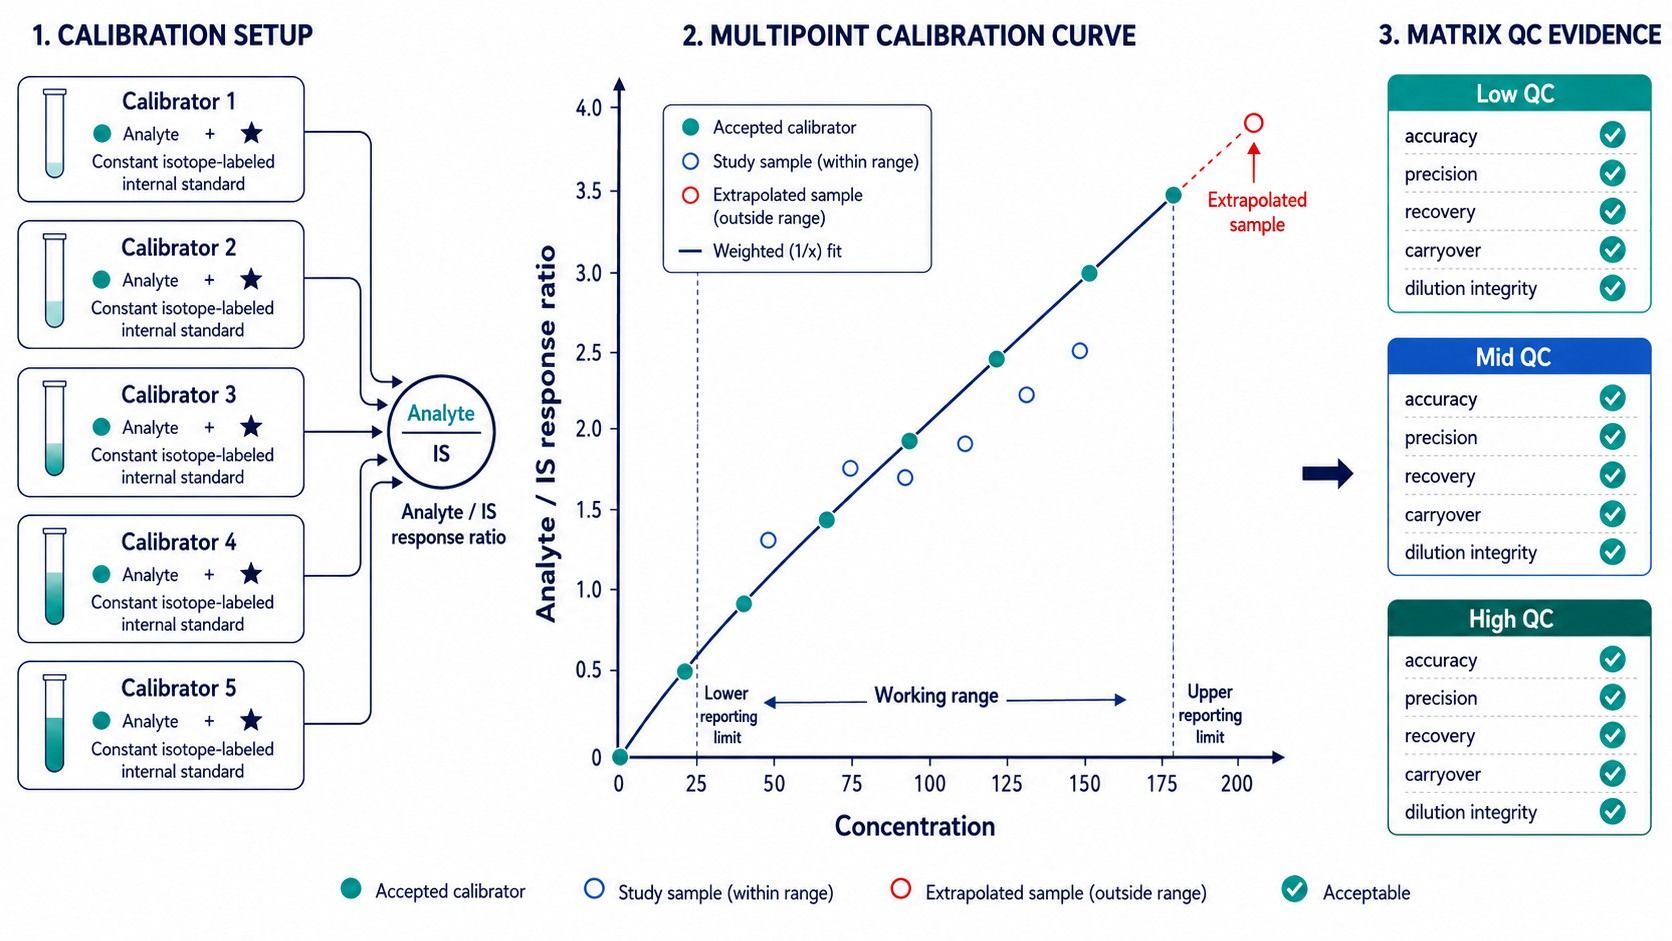 A lipid quantification decision tree links study questions to relative, absolute, or hybrid results.
Common Lipid Quantification Interpretation Errors
| Interpretation error | Why it is incorrect | Better reporting |
|---|---|---|
| Comparing raw peak areas of two different lipids | Ionization and response factors differ | Compare each lipid across samples or use validated concentrations |
| Calling analyte/standard ratio an absolute concentration | No calibration model or unit is established | Report normalized response unless calibration supports concentration |
| Treating one class standard as matched to every species | Structural response can vary within a class | State surrogate assignments and evidence level |
| Assuming targeted always means absolute | Targeted acquisition can still be relative | Verify standards, curve, range, accuracy, and QC |
| Assuming untargeted can never be quantitative | Calibrated or hybrid workflows can quantify selected features | Specify which analytes have supported concentration estimates |
| Comparing ng/mL with pmol/mg directly | Units and denominators differ | Convert only with valid molecular and sample information |
| Selecting normalization after seeing the result | Analytical flexibility can change conclusions | Prespecify the primary denominator and sensitivity analyses |
| Reporting more structural detail than the MS evidence supports | Quantification may be assigned to the wrong isomer | Match the name and concentration claim to identification evidence |
Planning Lipid Quantification with Creative Proteomics
A productive project discussion starts with the biological question, matrix, available sample amount, group structure, expected lipid classes, named targets if known, desired units, concentration range if available, and whether the endpoint must transfer across studies.
Creative Proteomics can combine broad profiling with targeted panel development, matrix-aware extraction, internal-standard selection, calibration, QC, structural confirmation, and statistical reporting. Class-focused services can also be incorporated when the question concerns a defined pathway rather than the whole lipidome.
If a concentration value will change the study conclusion, identify that requirement before samples are analyzed. If broad coverage is the priority, begin with relative profiling and reserve material for targeted confirmation. This alignment makes the quote, sample plan, and final deliverables more precise.
FAQs
Does an isotope-labeled internal standard make a result absolute?
Not by itself. A labeled internal standard improves correction for technical variation, but absolute reporting also requires an appropriate calibration model, supported range, matrix evaluation, analyte identity, and defined reporting unit.
Can untargeted lipidomics report concentrations?
It can provide calibrated estimates for selected lipids when standards and validation are incorporated. Most untargeted features remain relative or semiquantitative because matched standards and analyte-specific calibration are unavailable. The report should distinguish these evidence levels.
Is relative quantification reproducible across different studies?
Relative results can reproduce direction and association when workflows are closely harmonized, but numeric peak areas are usually platform and method dependent. Shared reference materials, internal standards, bridge samples, and consistent processing improve comparability without making the data absolute.
How many internal standards are needed for lipidomics?
The number depends on lipid classes, retention range, polarity, structural diversity, and quantitative claims. Broad profiling uses representative class standards, whereas absolute targeted panels ideally use matched labeled standards for each analyte or a validated surrogate strategy.
Should tissue lipid concentrations be normalized to weight or protein?
Use the denominator that represents the biological question and can be measured consistently. Wet weight reflects amount per tissue mass; protein or DNA may better represent cellular material. Prespecify the primary unit and avoid switching denominators after results are known.
Can relative and absolute results appear in the same report?
Yes. A hybrid report can provide validated concentrations for selected targets and relative abundance for the broader lipidome. Each column must clearly state its quantification basis, unit, standard assignment, and structural identification level.
References:
- Alseekh, S., Aharoni, A., Brotman, Y., et al. (2021). Mass spectrometry-based metabolomics: a guide for annotation, quantification and best reporting practices. Nature Methods, 18, 747–756. https://doi.org/10.1038/s41592-021-01197-1
- Cajka, T., Smilowitz, J. T., & Fiehn, O. (2017). Validating quantitative untargeted lipidomics across nine liquid chromatography–high-resolution mass spectrometry platforms. Analytical Chemistry, 89(22), 12360–12368. https://doi.org/10.1021/acs.analchem.7b03404
- Drotleff, B., & Lämmerhofer, M. (2019). Guidelines for selection of internal standard-based normalization strategies in untargeted lipidomic profiling by LC-HR-MS/MS. Analytical Chemistry, 91(15), 9836–9843. https://doi.org/10.1021/acs.analchem.9b01505
- Jung, H. R., Sylvänne, T., Koistinen, K. M., et al. (2021). A combined flow injection/reversed-phase chromatography-high-resolution mass spectrometry workflow for accurate absolute lipid quantification with 13C internal standards. Analyst, 146, 2177–2189. https://doi.org/10.1039/D0AN02443K
- Khoury, S., Canlet, C., Lacroix, M. Z., et al. (2018). Quantification of lipids: model, reality, and compromise. Biomolecules, 8(4), 174. https://doi.org/10.3390/biom8040174
- Smirnov, D., Mazin, P., Osetrova, M., et al. (2021). The hitchhiker's guide to untargeted lipidomics analysis: practical guidelines. Metabolites, 11(11), 713. https://doi.org/10.3390/metabo11110713
- Wang, M., Wang, C., & Han, X. (2017). Selection of internal standards for accurate quantification of complex lipid species in biological extracts by electrospray ionization mass spectrometry—what, how and why? Mass Spectrometry Reviews, 36(6), 693–714. https://doi.org/10.1002/mas.21492