Targeted Quantification of Serum Lipid Classes
Precise quantification of lipid classes (glycerolipids, phospholipids, sphingolipids, sterols, glycolipids) using MRM/PRM-based LC-MS/MS and isotope-labeled internal standards.
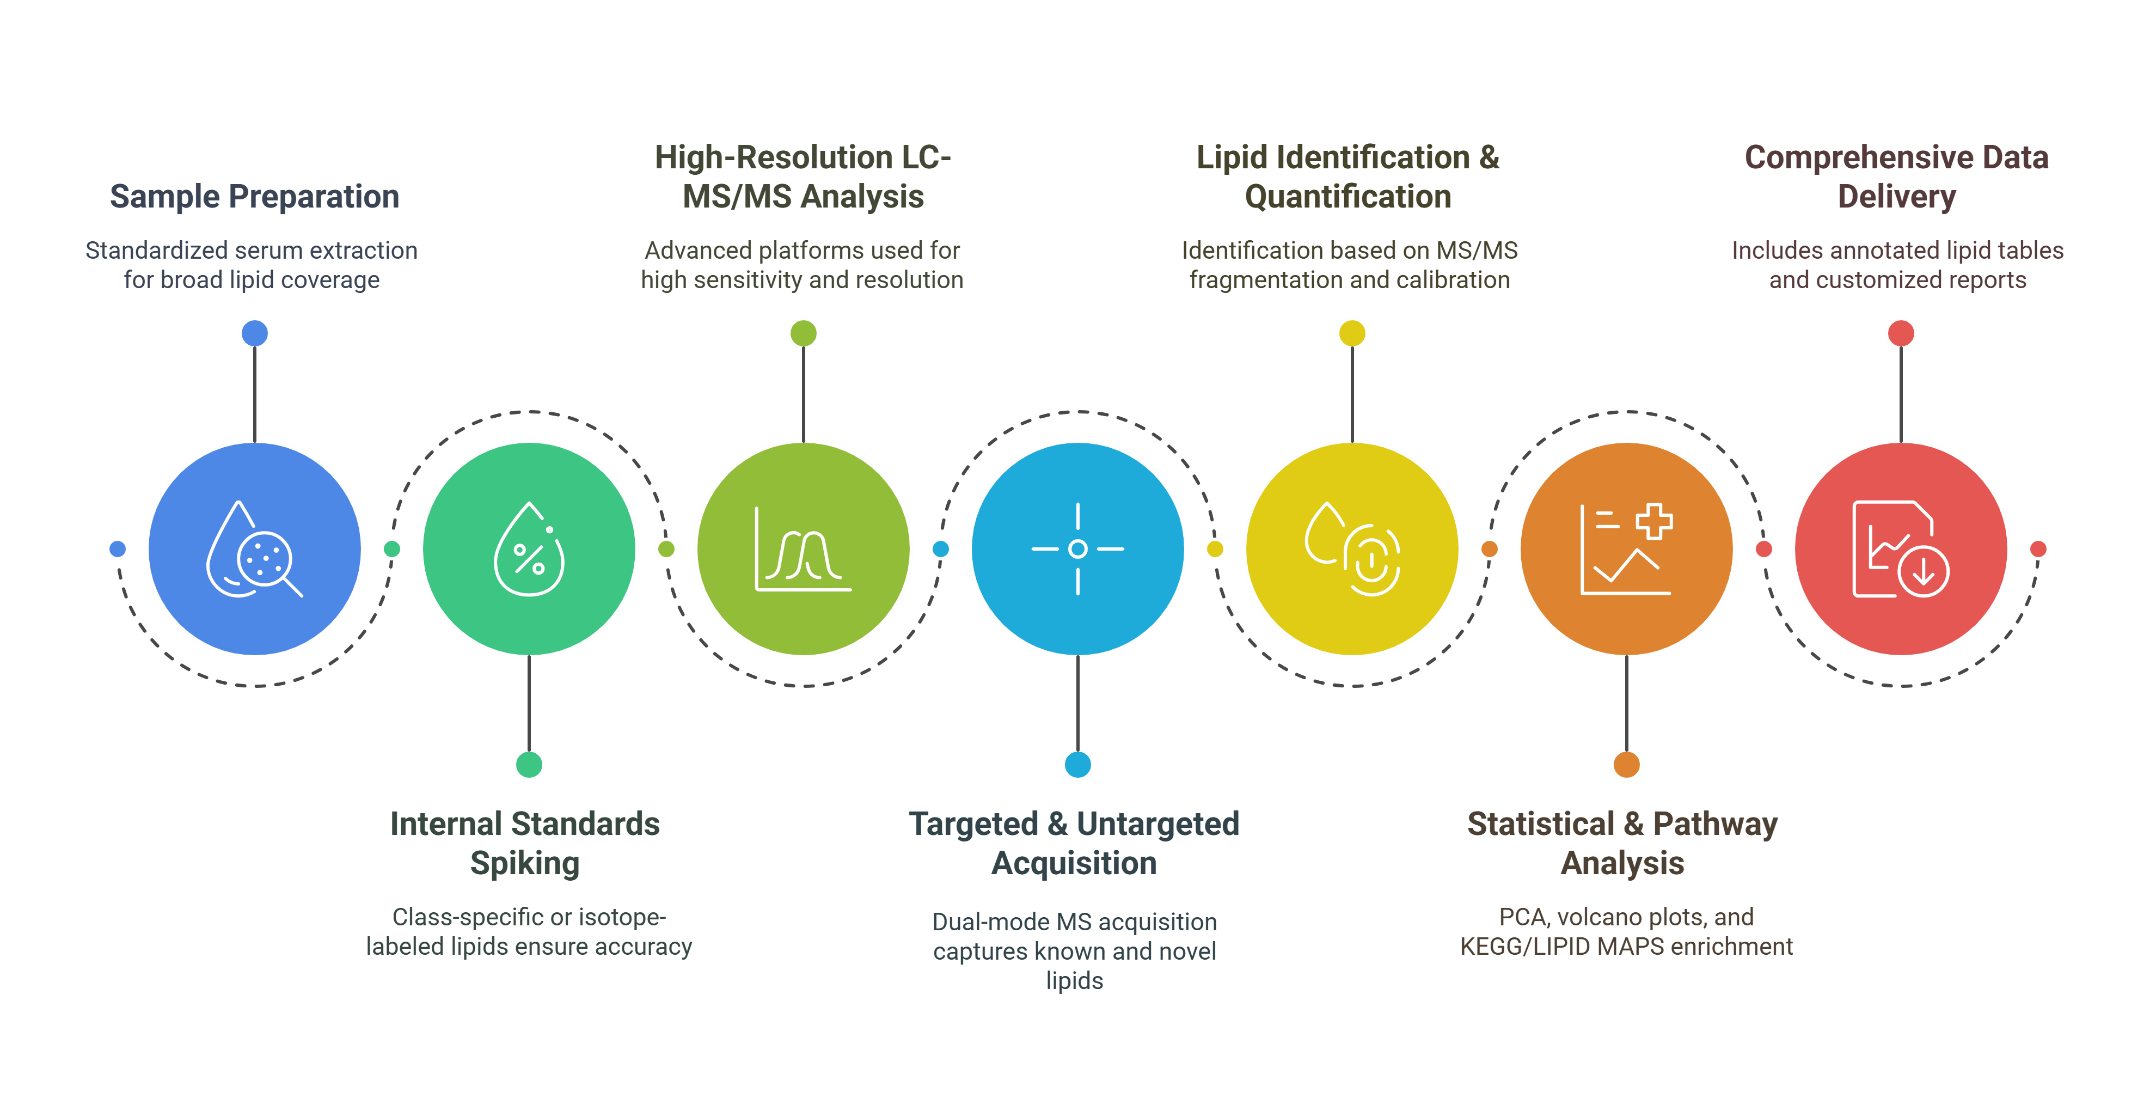
Creative Proteomics offers high-throughput, quantitative serum lipidomics analysis using advanced LC-MS/MS platforms to profile over 1,000 lipid species across key metabolic pathways. Our targeted and untargeted services help researchers uncover lipid alterations, map biochemical networks, and support studies in metabolism, nutrition, aging, and environmental response. With precise quantification, pathway enrichment, and customizable workflows, we deliver reliable, publication-ready data to accelerate lipidomics research.
Submit Your Request Now
×Our services have earned the trust of companies, schools, and organizations globally, and we remain dedicated to maintaining that trust.


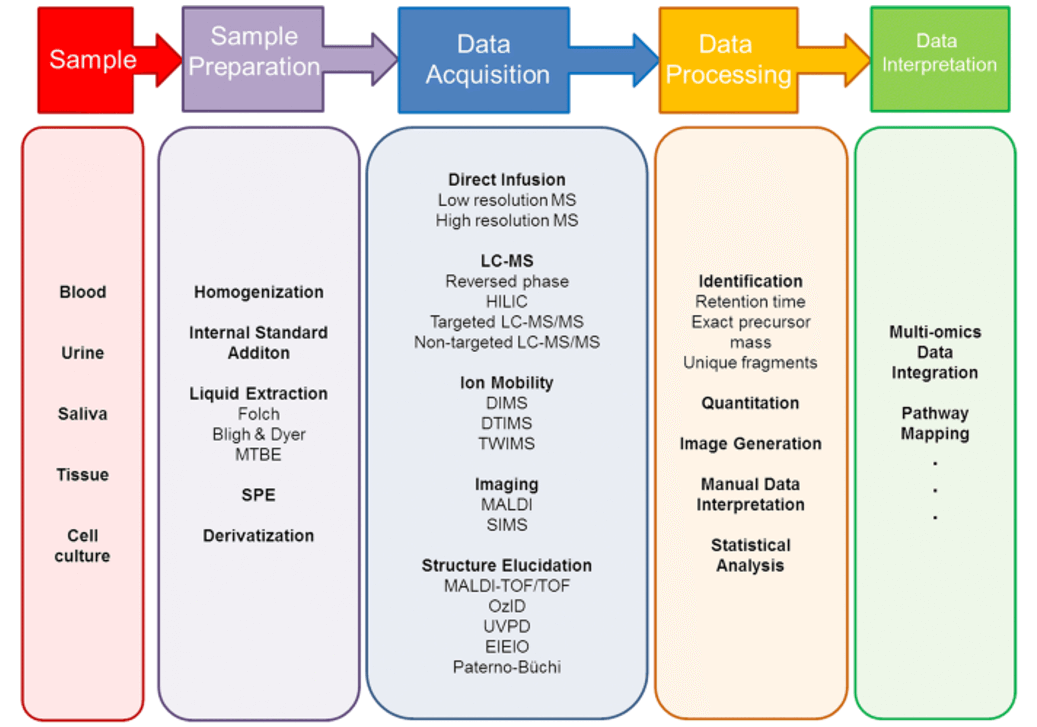
In lipidomics, sample selection is a critical factor that directly influences the quality, coverage, and interpretability of lipid profiling data. Among various biological matrices, serum stands out as a preferred and versatile sample type for systemic lipid analysis in basic research, biochemical studies, and large-scale metabolomic investigations.
Serum lipidomics is particularly suitable when:
By offering a high-resolution, systemic view of lipid alterations across experimental conditions, serum-based lipidomics provides a robust foundation for understanding complex metabolic networks and regulatory mechanisms.

Targeted Quantification of Serum Lipid Classes
Precise quantification of lipid classes (glycerolipids, phospholipids, sphingolipids, sterols, glycolipids) using MRM/PRM-based LC-MS/MS and isotope-labeled internal standards.

Untargeted Serum Lipid Profiling
Comprehensive lipid profiling using high-resolution LC-MS/MS to identify and characterize hundreds of lipid species, revealing unexpected lipidomic shifts.

Lipid Species Characterization
Structural identification of lipids, including acyl chain length, unsaturation, and modification, via tandem MS and accurate mass analysis.

Oxidized Lipid Analysis
Quantification of oxidized lipids, such as OxPLs and oxylipins, to investigate oxidative stress and lipid peroxidation.

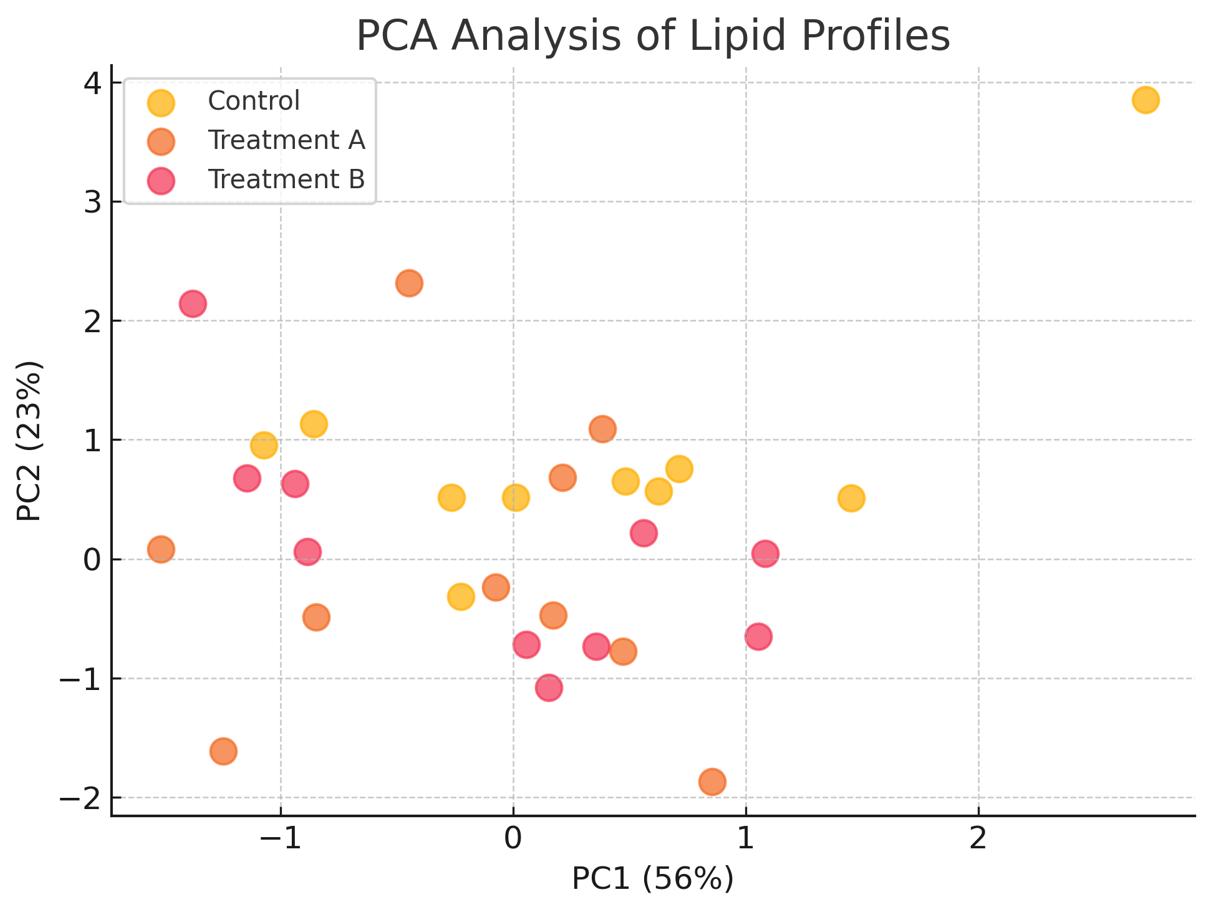
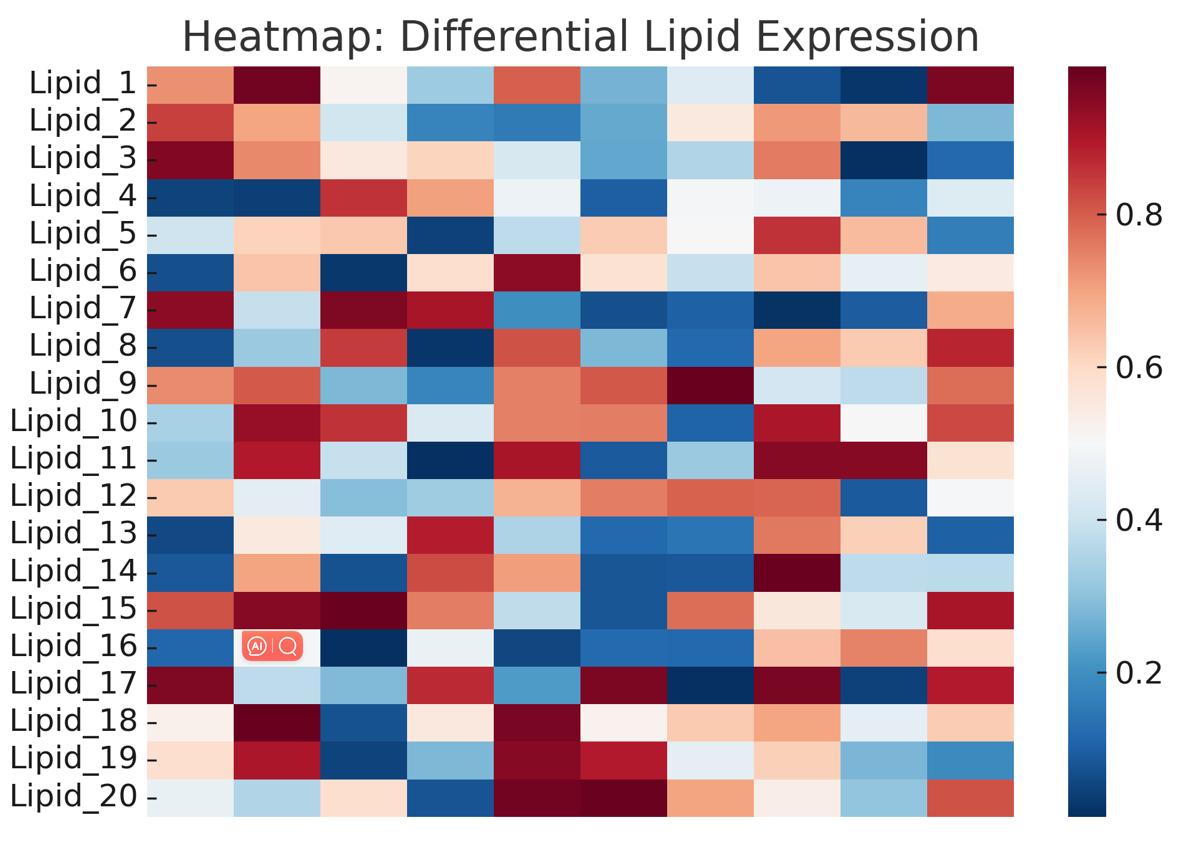
Differential Lipidomics Analysis
Comparative analysis to identify differentially expressed lipids across experimental conditions or treatment groups, with statistical validation.

Pathway Enrichment & Mapping
Integration of lipid data with metabolic pathways using KEGG, LIPID MAPS, and Reactome for functional analysis and pathway visualization.

Customized Lipid Panel Development
Tailored lipid panels for specific research needs, including LOD/LOQ validation and standard curve generation.

Time-Series & Dose-Response Lipid Dynamics
Lipidomic analysis over time or under different doses to capture metabolic changes and trends.
To address diverse biological questions across plant systems, Creative Proteomics also provides organ- and compartment-specific lipidomics solutions:
| Lipid Subclass | Representative Species | Related Metabolites | Key Pathways |
|---|---|---|---|
| Phosphatidylcholine (PC) | PC 16:0/18:1, PC 18:0/20:4 | Lyso-PC, Choline | Glycerophospholipid metabolism, membrane fluidity |
| Phosphatidylethanolamine (PE) | PE 18:1/18:2, PE 16:0/22:6 | Lyso-PE, Ethanolamine | Membrane remodeling, autophagy |
| Phosphatidylserine (PS) | PS 18:0/18:1 | Serine | Apoptosis signaling |
| Phosphatidylinositol (PI) | PI 18:0/20:4 | Inositol | PI cycle, intracellular signaling |
| Phosphatidic Acid (PA) | PA 16:0/18:1 | G3P | Lipid biosynthesis |
| Lipid Subclass | Representative Species | Related Metabolites | Key Pathways |
|---|---|---|---|
| Ceramides (Cer) | Cer d18:1/24:0, Cer d18:1/16:0 | Sphingosine | Apoptosis, insulin resistance |
| Sphingomyelins (SM) | SM d18:1/16:0, SM d18:1/24:1 | Choline | Myelin sheath structure, cell signaling |
| Hexosylceramides (HexCer) | GluCer, GalCer | Glucose, Galactose | Glycosphingolipid metabolism |
| Lactosylceramides (LacCer) | LacCer d18:1/24:1 | UDP-Gal, Glucose | Inflammatory signaling |
| Sphingosine-1-Phosphate (S1P) | — | S1P | Immune modulation, vascular integrity |
| Lipid Subclass | Representative Species | Related Metabolites | Key Pathways |
|---|---|---|---|
| Triacylglycerols (TAG) | TG 16:0/18:1/18:2, TG 18:1/18:1/18:1 | Glycerol, Free fatty acids | Lipogenesis, energy storage |
| Diacylglycerols (DAG) | DG 18:1/18:2, DG 16:0/18:1 | Glycerol, DAG | Lipid signaling, PKC activation |
| Monoacylglycerols (MG) | MG 18:1, MG 16:0 | Glycerol | Lipolysis, endocannabinoid metabolism |
| Lipid/Metabolite | Representative Species | Related Metabolites | Key Pathways |
|---|---|---|---|
| Free Fatty Acids (FFA) | Palmitate (16:0), Oleate (18:1), Arachidonate (20:4) | Acetyl-CoA | β-oxidation, fatty acid synthesis |
| Acylcarnitines | C2, C4, C16, C18:1, C18:2 | L-carnitine, CoA | Mitochondrial transport, energy homeostasis |
| Lipid Subclass | Representative Species | Related Metabolites | Key Pathways |
|---|---|---|---|
| Cholesterol | Free cholesterol | Lanosterol, Desmosterol | Steroid biosynthesis |
| Cholesteryl Esters (CE) | CE 18:1, CE 20:4 | Cholesterol | Lipoprotein metabolism |
| Oxysterols | 7-Ketocholesterol, 27-Hydroxycholesterol | Bile acids | Oxidative stress, bile acid synthesis |
| Lipid Type | Representative Species | Related Metabolites | Key Pathways |
|---|---|---|---|
| Oxidized Phospholipids | OxPC, OxPE | 4-HNE, MDA | Lipid peroxidation, redox regulation |
| Oxylipins | 12-HETE, 15-HETE, EETs | Arachidonic acid, EPA, DHA | Eicosanoid biosynthesis, inflammation |
| Eicosanoids | Prostaglandins, Leukotrienes | Thromboxanes, Resolvins | Inflammatory and resolution signaling |
| Lipid Subclass | Representative Species | Related Metabolites | Key Pathways |
|---|---|---|---|
| Lyso-PC | Lyso-PC 16:0, Lyso-PC 18:2 | G3P, Choline | Membrane turnover, lipid signaling |
| Lyso-PE | Lyso-PE 18:1 | Ethanolamine | Endocytosis, inflammatory signaling |
| Lyso-PS / Lyso-PI | Lyso-PS 18:0, Lyso-PI 20:4 | Serine, Inositol | Apoptotic signaling, immune response |
High-Resolution LC-MS/MS
High-resolution mass spectrometry (240,000 FWHM). Excellent mass accuracy (≤2 ppm).
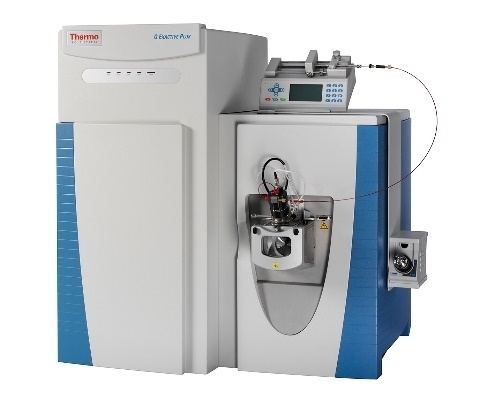
Thermo Fisher Q Exactive (Orbitrap LC-MS/MS) (Figure from Thermo Fisher)
Targeted LC-MS/MS
For targeted quantification with MRM transitions. Dynamic range: 5–6 orders of magnitude.
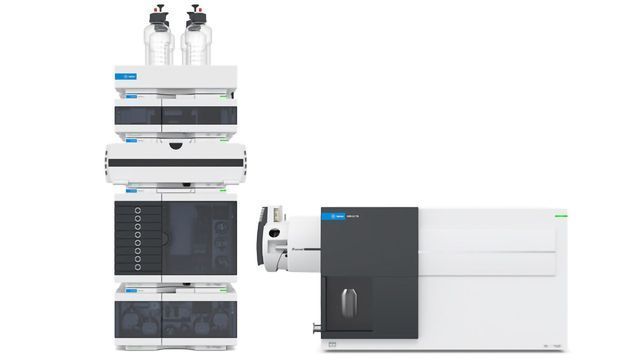
Agilent 6495C + 1260 HPLC (Figure from Agilent)
Explore our Lipidomics Solutions brochure to learn more about our comprehensive lipidomics analysis platform.

| Sample Type | Required Volume per Sample | Handling Instructions |
|---|---|---|
| Serum (Plasma) | 200-500 µL | Centrifuge at 3000 x g for 10 minutes at 4°C. Collect serum in sterile tubes. |
| Blood (For Plasma Separation) | 1 mL (Whole Blood) | Use EDTA or heparin tubes for collection. Separate plasma within 1 hour. |
| Frozen Serum Samples | 200-500 µL | Avoid freeze-thaw cycles. Keep samples in tightly sealed tubes. |
| Samples from Specific Conditions (e.g., disease models, treatment groups) | 200-500 µL | Ensure collection protocols are standardized across groups. |
| Quality Control Samples | 50-100 µL | Can be pooled from multiple serum samples for consistency. |

Nutritional Science
Exploring lipid metabolic changes in response to diet, identifying biomarkers for nutritional interventions.

Metabolic Research
Investigating lipid dysregulation in metabolic diseases like obesity, diabetes, and cardiovascular conditions.

Environmental Stress Studies
Analyzing the impact of environmental factors (e.g., pollutants, toxins) on lipid metabolism and cellular function.

Aging Research
Profiling age-related lipidomic shifts to uncover biomarkers for aging and age-associated diseases.

Exercise Physiology
Understanding lipidomic alterations in response to different exercise regimens and their effects on performance and recovery.

Pharmacology and Toxicology
Assessing the impact of drug treatments or toxic exposures on lipid metabolism and related pathways.
How do you handle technical replicates, and are they required?
We recommend triplicate analysis for untargeted studies to ensure statistical robustness, particularly for low-abundance lipids. However, replicates are optional and tailored to project budgets. Data integration across replicates reduces false positives and improves confidence in lipid identification .
Can I submit animal serum samples (e.g., mouse, rat) for analysis?
Yes. Our workflows are optimized for human, mouse, rat, and primate serum. Species-specific lipid databases and extraction protocols are applied to account for interspecies variability (e.g., higher sphingomyelin in rodents) .
How do you address hemolyzed or lipemic serum samples?
Hemolysis: We perform phospholipid removal filters to minimize hemoglobin interference.
Lipemia: Ultracentrifugation (20,000 × g, 30 min) isolates chylomicrons, ensuring accurate quantification of non-lipoprotein-bound lipids .
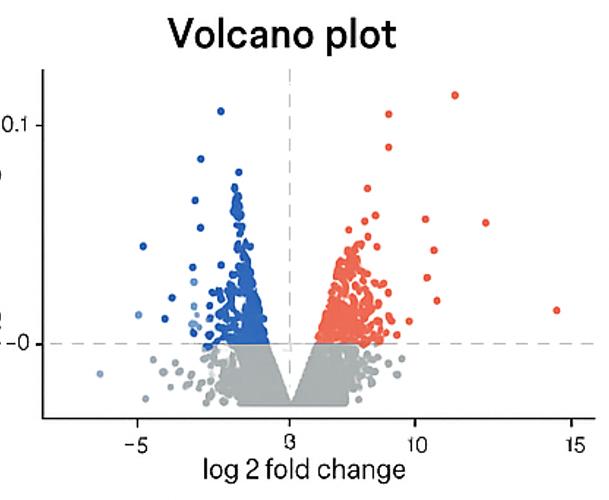
What bioinformatics support do you provide for data interpretation?
We offer free preliminary analysis, including pathway enrichment (via KEGG/Reactome), heatmaps, and volcano plots. Advanced options include machine learning-based biomarker prioritization or integration with transcriptomic/proteomic datasets .
Is there a discount for large-scale or longitudinal studies?
Yes. Projects involving >200 samples qualify for a 15% volume discount. Longitudinal studies benefit from batch-effect correction algorithms to ensure data consistency across time points .
Can you analyze oxidized lipids or lipid peroxidation products?
Yes. Our Orbitrap Fusion Lumos platform detects oxidized species (e.g., 4-HNE, isoprostanes) at sensitivities down to 0.5 pg/mL using derivatization-assisted workflows .
Do you support custom lipid panels for niche research areas?
Absolutely. We develop project-specific panels for understudied lipid classes (e.g., sulfolipids, plasmalogens), validated with spike-and-recovery experiments (85–115% recovery rate) .
How do you compare to other lipidomics service providers?
Our multi-platform integration (UPLC, IMS, HRMS) resolves co-eluting/isobaric lipids more effectively than single-platform workflows. Additionally, >95% of our lipid identifications are backed by MS/MS spectral matching, exceeding industry standards .

References
Services:
Resource:
Platform:
Online Inquiry
CONTACT US