What is Lactosylceramide?
Lactosylceramide is a type of glycosphingolipid, which is a complex molecule composed of a ceramide (a lipid) linked to a lactose sugar. Structurally, it consists of a ceramide backbone (which includes a sphingosine and a fatty acid chain) linked to a lactose molecule through a glycosidic bond. This molecule is found in cell membranes, particularly in tissues like the brain and kidneys.
Functionally, lactosylceramide is involved in various cellular processes, including cell recognition, signaling, and adhesion. It plays roles in immune responses, cell differentiation, and possibly in the regulation of cell growth and apoptosis (programmed cell death). Additionally, lactosylceramide has been implicated in certain disease processes, such as cancer and neurodegenerative disorders, where its aberrant expression or metabolism may contribute to pathogenesis.
At Creative Proteomics, we offer an extensive suite of lactosylceramide analysis services designed to meet the highest standards of scientific precision and accuracy.
Lactosylceramide Analysis Service Projects by Creative Proteomics
Lactosylceramide Structural Characterization
- Mass Spectrometry (MS): Utilizing cutting-edge MS technologies, we provide high-resolution analysis of lactosylceramide, identifying molecular species and elucidating structural details with exceptional accuracy.
- Nuclear Magnetic Resonance (NMR) Spectroscopy: NMR spectroscopy offers detailed information on the molecular structure and dynamics of lactosylceramide, enabling comprehensive structural elucidation.
Lactosylceramide Quantitative Analysis
- Liquid Chromatography-Mass Spectrometry (LC-MS): Our LC-MS techniques allow for precise quantification of lactosylceramide in various biological samples, ensuring accurate measurement of concentration levels.
- High-Performance Liquid Chromatography (HPLC): HPLC is employed for the separation and quantification of lactosylceramide, providing robust and reliable analytical results.
Lactosylceramide Metabolic Profiling
- Stable Isotope Labeling: We utilize stable isotope labeling techniques to trace lactosylceramide metabolic pathways, offering insights into its biosynthesis and degradation.
- Metabolomics: Comprehensive metabolomic profiling of lactosylceramide and related glycosphingolipids is performed to understand their metabolic interactions and regulatory mechanisms.
Functional Assays
- Cell-Based Assays: Our cell-based assays evaluate the biological functions of lactosylceramide, including its role in cell signaling, immune responses, and cell adhesion.
- Enzyme Activity Assays: Enzyme assays measure the activity of enzymes involved in lactosylceramide metabolism, such as lactosylceramide synthase and glycosidases.
Disease Association Studies
- Biomarker Discovery: We identify and validate lactosylceramide as a biomarker for various diseases, aiding in early diagnosis and therapeutic targeting.
- Pathway Analysis: Our pathway analysis services elucidate the involvement of lactosylceramide in disease mechanisms, providing insights into potential therapeutic interventions.
Analytical Techniques for Lactosylceramide Analysis
Mass Spectrometry (MS): Mass spectrometry is a cornerstone in lactosylceramide analysis, offering high sensitivity and specificity. Techniques such as MALDI-TOF (Matrix-Assisted Laser Desorption/Ionization Time-of-Flight) and ESI-MS (Electrospray Ionization Mass Spectrometry) are utilized to accurately identify and characterize lactosylceramide species.
Liquid Chromatography-Mass Spectrometry (LC-MS): LC-MS combines the separation capabilities of liquid chromatography with the detection power of mass spectrometry. This technique is invaluable for quantitative analysis and metabolic profiling of lactosylceramide in complex biological samples.
Nuclear Magnetic Resonance (NMR) Spectroscopy: NMR spectroscopy provides detailed structural information at the atomic level, elucidating the conformational dynamics and interactions of lactosylceramide within biological systems.
High-Performance Liquid Chromatography (HPLC): HPLC is a highly effective technique for separating and quantifying lactosylceramide. It offers robust and reproducible results, making it ideal for routine analysis and quality control.
Stable Isotope Labeling and Metabolomics: Stable isotope labeling, combined with metabolomic profiling, allows for comprehensive analysis of lactosylceramide metabolic pathways. This approach provides valuable insights into its biosynthesis, turnover, and regulatory mechanisms.
Sample Requirements for Lactosylceramide Analysis
| Sample Type | Recommended Quantity |
|---|
| Blood Plasma/Serum | Minimum 500 µL |
| Tissue Samples | Minimum 50 mg (wet weight) |
| Cell Culture | Minimum 1 x 10⁶ cells |
| Urine | Minimum 10 mL |
| Cerebrospinal Fluid (CSF) | Minimum 500 µL |
If you have any questions about our lipidomics services, please contact us.
Case Role of Lactosylceramide in Atherosclerosis and Acute Myocardial Infarction
Background
Lactosylceramide, a lipid species implicated in cellular membrane dynamics, has been found at elevated levels in familial hypercholesterolemia and atherosclerotic lesions. It is associated with increased pro-inflammatory cytokines and macrophage content in plaques, potentially contributing to plaque instability and acute myocardial infarction (AMI).
Samples
The study examined monocytes isolated from AMI patients and healthy controls to investigate lipid composition, focusing on lactosylceramide, phosphatidylethanolamine (PE), and lysophosphatidylethanolamine (lPE).
Technical Methods
Lipid Extraction and Quantification:
- Sample Preparation: Monocytes were isolated from peripheral blood of AMI patients and healthy controls using standard density gradient centrifugation.
- Lipid Extraction: Lipids were extracted from isolated monocytes using a solvent extraction method, such as chloroform/methanol extraction.
- Lipid Class Separation: Separation of different lipid classes was achieved using thin-layer chromatography (TLC) or solid-phase extraction (SPE).
- Quantitative Analysis: Quantification of lactosylceramide, phosphatidylethanolamine (PE), and lysophosphatidylethanolamine (lPE) was performed using liquid chromatography coupled with tandem mass spectrometry (LC-MS/MS). This method allows for precise measurement of lipid levels in biological samples.
Cell Culture Experiments:
- Monocyte Treatment: Isolated monocytes were cultured in vitro and treated with exogenous lactosylceramide to simulate elevated levels found in AMI patients.
- Inhibitor Studies: The impact of D-PDMP, an inhibitor of glucosylceramide and lactosylceramide synthases, was assessed on monocyte migration and lipid metabolism pathways.
- Stimulation Assays: Monocytes were also stimulated with pro-inflammatory cytokines (e.g., IL-6, MCP-1) or oxidized LDL (ox-LDL) to mimic conditions present in atherosclerotic plaques.
Data Analysis:
- Correlation Studies: Statistical analysis was conducted to correlate lipid levels (lactosylceramide, PE, lPE) with clinical parameters such as plaque content of cytokines, monocyte migration indices, and patient demographics (e.g., age, sex).
- Bioinformatics Tools: Computational tools were utilized to analyze lipidomics data, identify significant lipid species, and visualize lipid pathway alterations.
- Experimental Controls: Proper controls were implemented, including untreated monocytes and vehicle-treated cells, to validate experimental findings and ensure specificity of results.
Additional Techniques:
- Immunofluorescence and Microscopy: Visualization techniques were employed to assess cellular localization of lactosylceramide within monocytes and its impact on cell morphology.
- Gene Expression Analysis: Real-time PCR or RNA sequencing may have been used to evaluate expression levels of enzymes involved in lipid metabolism pathways, such as lactosylceramide synthase.
Quality Control and Validation:
- Reproducibility: Experiments were performed in triplicate or more to ensure reproducibility of results.
- Validation: Findings were validated using independent experimental approaches and possibly replicated in animal models to confirm relevance to human pathology.
Results
Elevated lactosylceramide levels in familial hypercholesterolemia and atherosclerotic lesions.
Positive correlation between lactosylceramide levels and pro-inflammatory cytokines (e.g., IL-6, MCP-1) in plaques.
Increased monocyte migration associated with higher lactosylceramide levels, inhibited by D-PDMP.
Elevated PE and lPE levels in AMI patient monocytes, suggesting alterations in phospholipid metabolism.
Presence of gangliosides in atherosclerosis, though not detected in nonpolar lipid analysis.
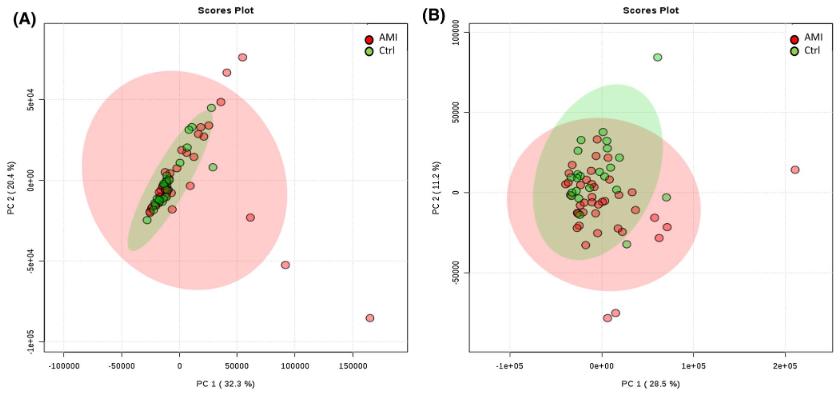
 Pincipal component analysis (PCA) of lipids extracted from monocytes isolated from AMl patients and control subjects. A, PCA score plot obtained in positive ion mode. B, PCA score plot in negative ion mode
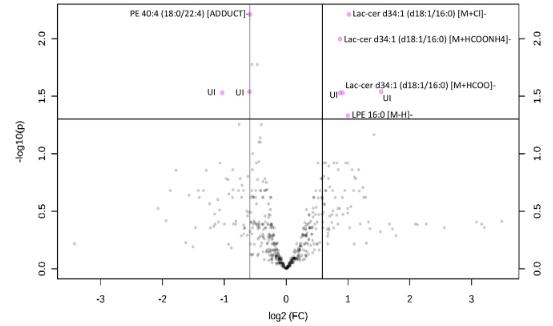
 Volcano plot obtained from the data set in the negative mode of lipids extracted from monocytes isolated from AMl patients (n = 4l) and control subjects (n = 23). The pink dots represent the lipid species having a log2-fold change (FC) equal or greater than + 0.58 (ie, +1.5 on linear scale) and p values <.05. The square on the top left discriminates the lipid species displaying both large magnitude FC and high statistical significance for controls, the square on the right top discriminates the lipid species significant in AMl patients.
Reference
- Fiorelli, Susanna, et al. "Lipidomics analysis of monocytes from patients with acute myocardial infarction reveals lactosylceramide as a new player in monocyte migration." The FASEB Journal 35.5 (2021): e21494.


 Pincipal component analysis (PCA) of lipids extracted from monocytes isolated from AMl patients and control subjects. A, PCA score plot obtained in positive ion mode. B, PCA score plot in negative ion mode
 Volcano plot obtained from the data set in the negative mode of lipids extracted from monocytes isolated from AMl patients (n = 4l) and control subjects (n = 23). The pink dots represent the lipid species having a log2-fold change (FC) equal or greater than + 0.58 (ie, +1.5 on linear scale) and p values <.05. The square on the top left discriminates the lipid species displaying both large magnitude FC and high statistical significance for controls, the square on the right top discriminates the lipid species significant in AMl patients.