- Home
- Services
- (Untargeted) Lipidomics Profiling
- Mammals Untargeted Lipidomics
- Brain Lipidomics Analysis
- Mouse Lipidomics
- Platelet Lipidomics
- Tissues Lipidomics
- Urinary Lipidomics
- Biofluid Lipidomics
- Mitochondria Lipid Metabolism Analysis
- Skin Lipidomics
- Cells Lipidomics
- Conditioned Medium Lipidomics
- Exosomes Lipidomics
- Plasma Lipidomics
- Serum Lipidomics Analysis
- Milk Lipidomics
- Microorganisms Untargeted Lipidomics
- Plant Lipidomics Analysis
- Algae Lipidomics Analysis
- Foods Untargeted Lipidomics
- Mammals Untargeted Lipidomics
- Targeted Lipidomics
- Fatty Acyls
- Acylcarnitine
- Hepoxilins
- Resolvins
- Isoprostanes
- Protectins D1
- Maresins
- Fatty Acid
- Fatty Acid Oxidation and its Metabolites
- Fatty Acid Methyl Ester
- Free Fatty Acids
- Short Chain Fatty Acids
- Volatile Fatty Acid (VFA)
- Fatty Acid Esters of Hydroxy Fatty Acids (FAHFAs)
- Oxylipins
- Phospholipid Fatty Acids
- Prostaglandins
- Leukotrienes
- Thromboxanes
- Lipoxins
- Endocannabinoids
- Hydroxy-Eicosatetraenoic Acids
- Mycolic Acids
- Epoxyeicosatrienoic Acids
- Neurofurans
- Jasmonic Acids
- Sophorolipids
- Rhamnolipids
- Isofurans
- Phytoprostanes
- Eicosanoid
- Wax Esters
- Heptadecanoids
- Glycerophospholipids
- Phosphatidylcholine
- Phosphatidylethanolamine
- Phosphatidylserine
- Phosphatidic Acid
- Phosphatidylglycerol
- Phosphatidylinositol
- Phosphoinositides
- Cardiolipins
- Lysophosphatidic Acid
- Lysophosphatidylcholine
- Lysophosphatidylserine
- Lysophosphatidylglycerol
- Lysophosphatidylethanolamine
- Lysophosphatidylinositol
- Ether-linked Phosphatidylcholine
- Plasmalogen
- Lysophospholipid Analysis Service
- Ether-linked Phosphatidylethanolamine
- CDP-Diacylglycerols
- LysoPAF
- LPE O-
- Bis(monoacylglycero)phosphate (BMP/LBPA)
- Glycerolipids
- Sphingolipids
- Glycolipids
- Acylceramides
- Ceramide 1-Phosphates
- Ceramides
- Cerebroside
- Dihexosylceramides
- Ganglioside
- Globoside
- Glucocerebroside
- Glucosylsphingosine
- Glycosphingolipid
- Hexosylceramide
- Inositol-P-Ceramide
- Phytoceramide
- Sphingomyelins
- Sphingosine 1-phosphate
- Sphingosine Base
- Sulfatides
- Lactosylceramide
- Glucosylceramide
- Sterol Lipids
- Prenol Lipids
- Phospholipids
- Saccharolipids
- Polyketides
- Fatty Acyls
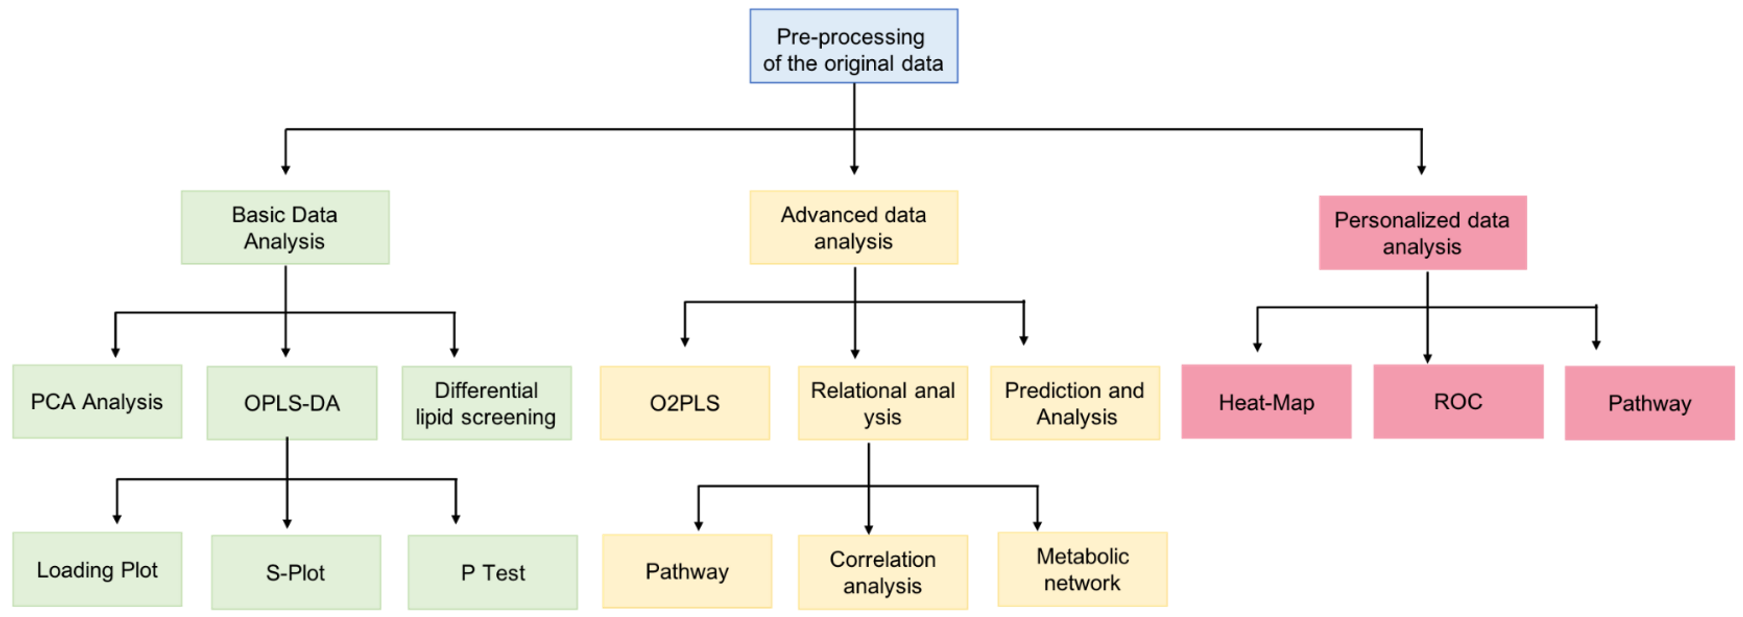
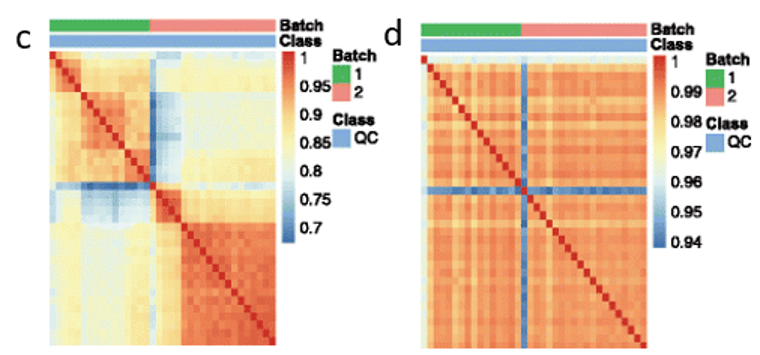
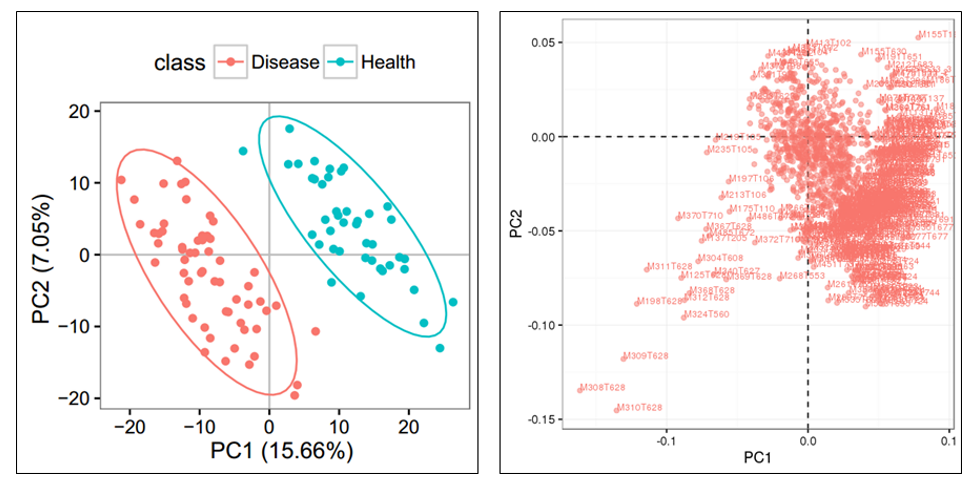
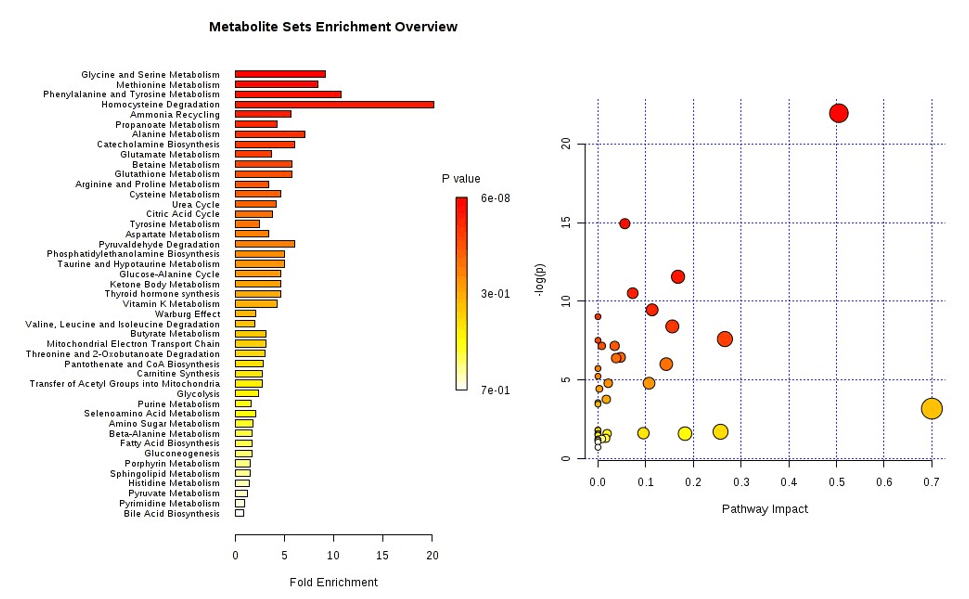
- Lipidomics Bioinformation Analysis
- MALDI-Imaging Lipidomic Service
- Metabolic Flux Analysis Services
- Others Service
- (Untargeted) Lipidomics Profiling
- Applications
- Pharma & Biotech
- Food & Nutrition
- Disease Research
- Precision Oncology & Ferroptosis Lipidomics
- Neuro-Metabolism Lipidomics for Brain Health Research
- Dermatology Lipidomics Services for Skin Barrier Function
- Immunology Lipidomics Services for Inflammatory Signaling
- Lipidomics in MAFLD, NASH and Cardiovascular Research
- Lipidomics for Immune Disease Research
- Environmental Toxicology
- Agriculture
- Microorganism
- Drug Analysis
- Fermentation Conditions Optimization Analysis
- Microbial Lipidomics for Microbial Cell Factory Engineering
- Antimicrobial Resistance and Bacterial Membrane Biology Lipidomics Service
- Fermentation Process Optimization and Dynamic Monitoring Lipidomics
- Host-Pathogen Interaction Lipidomics Services
- Cosmetics & Personal Care
- Resource
- About Lipids
- Platform
- Service Flow
- Sample Guidelines
- Knowledge Center
- Applications of Lipidomics in Discovery of Disease Biomarkers
- Applications of Lipidomics in Food Quality and Safety
- Applications of Lipidomics in Nutrition and Health
- Biological Functions of Lipids and Abnormalities of Lipid Metabolism
- Function, Application and Detection of Plant Sterols
- How to Detect Steroid Hormones?
- Lipidomics and Cancer Research
- Lipidomics in Microbiology
- Metabolic Flux Analysis in Tumor Research
- Detection of Intracellular Ceramide
- The Role of Mass Spectrometry and Chromatography in Lipidomics
- Untargeted vs. Targeted Lipidomics—Understanding the Differences
- Exploring the Roles of Phosphatidic Acid in Lipid Metabolism and Lipidomics Research
- Fatty Acids and Fatty Acid Metabolism
- Nomenclature and Function of Ceramide and Diseases Caused by Abnormal Ceramide Metabolism
- Lipoprotein A in Cardiovascular Disease
- The Role of Short-Chain Fatty Acids in Metabolic Diseases
- Overview of Long Chain Fatty Acid
- Overview of Omega-6 Fatty Acids
- Overview of Phosphatidylcholine
- Overview of Phosphatidylethanolamine
- Overview of Phosphatidylglycerol
- Lipidomics Databases and Software Tools for Biomedical Research
- What is Untargeted Lipidomics?
- Common Lipidomics Databases and Software
- What is Targeted Lipidomics?
- Overview of Gas Chromatography-Mass Spectrometry (GC-MS)
- Sphingosine-1-Phosphate: Structure, Functions, and Role in Cancer
- Glycosphingolipids: Structure, Metabolism, Functions, Analytical Methods and Biological Significance
- Phosphatidylserine Metabolism Structure, Functions, and Analytical Techniques
- Overview of Medium Chain Fatty Acids (MCFAs)
- Overview of Short-Chain Fatty Acids
- Short-Chain Fatty Acids in Gut Health and Metabolism
- Comprehensive Overview of Omega-3 Fatty Acids
- Difference Between Omega-3 and Omega-6 Fatty Acid
- Omega-3 Fatty Acids for Dogs & Cats
- Role of Omega-3 Fatty Acids in Brain Health
- Phospholipid Analysis Techniques: Principles, Methods, and Applications
- FAME Analysis Guide: Workflow, Sample Prep, Platform Selection, and QC Tips
- Arachidonic Acid Analysis: From Pathway Biology to Study Design and LC-MS/MS Assay Development
- How to Choose the Right Arachidonic Acid Analysis Strategy: LC-MS/MS, GC-MS, ELISA, and Panel Design
- When to Use Arachidonic Acid and Eicosanoid Analysis in Disease Research
- Advanced Arachidonic Acid Lipidomics and Multi-Omics Strategies for Mechanism and Preclinical Research
- Sample Preparation and Quality Control for Arachidonic Acid and Eicosanoid LC-MS/MS Results
- Saturated vs Unsaturated Fatty Acids: How to Select GC-FID, GC-MS, or LC-MS/MS for Quantitation
- Acid Sphingomyelinase Deficiency: Pathways, Sphingomyelinase Disorders, and Research Models
- How Saturated Fatty Acid Structure Affects GC Separation and Quantitative Accuracy
- Lecithin–Sphingomyelin Ratio (L/S Ratio): Biological Meaning and Research Applications
- Sphingomyelin Assays Compared: ELISA and Colorimetric Kits vs LC–MS/MS Quantification
- Neurolipidomics Strategy for Sphingomyelin Analysis in Brain Tissue and CSF
- Ceramide vs Sphingomyelin: Pathways, Differences & Measurement
- Sphingomyelin vs. Phosphatidylcholine: Structure, Composition, and Key Biological Differences
- Prostaglandin Measurement: LC-MS/MS vs ELISA—Choosing the Right Method
- COX-1 vs COX-2 Pathway: Mechanistic Differences and Analytical Strategies
- How to Prepare Samples for Prostaglandin Measurement
- 5 Key Research Areas Where Prostaglandin Analysis Is Transforming Biomedical Discovery
- How to Interpret Your Prostaglandin Analysis Report — From LC-MS/MS Data to Biological Insights
- Shotgun Lipidomics—Principles, Applications, and Best Practices
- The Role and Detection Methods of Long-Chain Fatty Acids
- How Are Short-Chain Fatty Acids Measured?
- Detection of Sphingomyelins
- Detection Strategies for Glycosphingolipids: Methods and Techniques
- Function and Analysis of Phosphatidic Acid
- Function and Analysis of Phosphatidylserine
- Function and Detection of Leukotrienes
- Phosphatidylcholine: Function and Detection
- Function and Detection of Sphingolipids
- Functions of Gangliosides and Association with Brain Diseases
- Metabolism and Detection of Sphingosine-1-Phosphate
- Metabolism and Detection of Triacylglycerol
- Phospholipids: Structure, Biosynthesis, Functions, and Role in Cellular Processes
- Analytical Methods to Quantify Free Fatty Acids
- Application of Lipidomics in Environmental Research
- Application of Lipidomics in Pharmaceutical Research
- Function and Detection Methods of Polyunsaturated Fatty Acids
- What Are Prostaglandins? A Guide to Function, Synthesis, and Measurement
- Introduction to Saturated Fatty Acids
- Methods of Lipidomics Analysis
- Infographic
- Brochures
- Blog
- Exosome Lipidomics: Understanding the Role of Lipids in Exosome Therapies
- Free Fatty Acids: Structure, Metabolism, Functions, and Measurement
- Understanding Plasma Lipidomics: An Introduction
- What is Thromboxane?
- What is Fatty Acid Methyl Ester?
- What is Triacylglycerol?
- What is Sterol?
- What is Sphingosine?
- What are Eicosanoids?
- What is GM2 Ganglioside?
- What is GM3 Ganglioside?
- What is Lipoxin?
- What is Monoacylglycerol?
- Medium Chain Fatty Acids: Metabolism, Health Benefits, and Analytical Methods
- What is Cardiolipin?
- What is Globoside?
- Glycerophospholipids: Essential Components of Cell Membranes and Cellular Functions
- What is Lipoprotein?
- Bile Acid: A Comprehensive Exploration of Function and Metabolism
- Exploring the Intricate Link Between Bile Acids and Disease
- Natural Lipids: Structure, Function, and Applications
- Waxes: Properties, Functions, and Analysis Techniques
- Cerebrosides: Structure, Function, and Analytical Methods
- Diacylglycerol: Structure, Functions, and Analytical Methods
- Lipidomics Pathway Analysis: Unraveling Cellular Lipid Metabolism and Signaling
- Company
- Inquiry