Phospholipid Class Composition
Quantify the major classes in one extraction and report them as class content and as the ratio between them, so the profile is internally consistent rather than assembled from separate measurements.


Lecithin is a mixed phospholipid raw material, so its composition is a distribution rather than a single figure. We quantify the phospholipid classes, the lysophospholipids formed by hydrolysis, the non-phospholipid fraction, and the acyl profile of a lecithin sample, and we report each value with the method and the basis behind it, because the same material reads differently depending on how the number was obtained.
What we analyze: phospholipid classes, lysophospholipids, the non-phospholipid fraction including sterols and glycolipids, and the fatty acyl profile
Technology: 31P-NMR for class-level molar composition, HPLC with charged aerosol or light scattering detection for class separation, LC-MS/MS for species detail, and GC for the acyl profile
Reporting options: class content as mass or mole percent, acetone-insoluble matter, lysophospholipid level, component ratios, and acyl distribution
Submit Your Request Now
×Our services have earned the trust of companies, schools, and organizations globally, and we remain dedicated to maintaining that trust.









A lecithin is bought and sold on its composition, and the same word covers products that behave quite differently. Fluid lecithin, deoiled lecithin, and a hydrolysed or fractionated grade differ in phospholipid content and in the proportion of each class, and those differences decide emulsifying behaviour, oxidative stability, and how the material performs in a formulation.
A single figure such as a phosphatidylcholine content is therefore hard to interpret on its own. What makes a result usable is knowing which classes were measured, whether the value is mass or mole percent, which method produced it, and whether the sample is in its native form or has been modified during processing.
Lecithin is a trade name for a mixed phospholipid fraction obtained when a crude oil is degummed, and phosphatidylcholine is only one of its components. A sample may also contain phosphatidylethanolamine, phosphatidylinositol, phosphatidic acid, glycolipids, sterols, and residual oil, and the balance between them is what the buyer is really specifying. Phosphatidylcholine itself is measured on our phosphatidylcholine analysis route, while a lecithin is reported as the whole mixture.
The routes below address different parts of the same material. They can be run as one project or chosen individually, and the choice usually follows from which part of the specification the decision depends on.
Phospholipid Class Composition
Quantify the major classes in one extraction and report them as class content and as the ratio between them, so the profile is internally consistent rather than assembled from separate measurements.
Lysophospholipid and Hydrolysis Assessment
Measure the lysophospholipids and free fatty acids that mark hydrolysis, which are elevated by design in a hydrolysed grade and rise slowly in any lecithin that has been stored warm.
Non-Phospholipid Fraction
Report acetone-insoluble matter, residual oil, free fatty acids, sterols, and glycolipids beside the phospholipid classes, because a class percentage means little without the fraction it was calculated against.
Fatty Acyl Profile
Profile the acyl chains of the phospholipid fraction for chain length and unsaturation, which connects the composition of the material to its oxidation behaviour and to the nutritional claim attached to the oil.
Source and Grade Comparison
Run soy, sunflower, rapeseed, egg, or a custom material through the same measurement set, so a supplier change or a grade change is read as a composition difference rather than described in words.
Process and Stability Comparison
Apply the same analysis before and after a degumming, modification, or storage step, which is how a change in the process is connected to a measurable change in the product.
Four groups of values cover what a lecithin specification usually needs, and each one is reported with the basis on which it was calculated. The tables below list what is measured in each group and how the value is expressed.
Class content is the headline figure in a lecithin specification, and what it means depends on the method used to obtain it.
| Component | Why It Matters | Reported As |
|---|---|---|
| Phosphatidylcholine | The main emulsifying component and the class most often written into a specification | Content per class, as mass or mole percent, with the method named |
| Phosphatidylethanolamine | Sets hydration behaviour and belongs to the fraction that resists plain water degumming | Content per class, reported beside phosphatidylcholine rather than in place of it |
| Phosphatidylinositol | Usually higher in sunflower lecithin than in soy, so it is one of the markers that distinguishes sources | Content per class, with the ratio to phosphatidylcholine given alongside |
| Phosphatidic acid and minor classes | Small in amount but relevant to surface charge and to behaviour at an oil and water interface | Content per class where resolvable, or grouped as minor classes where the amount is small |
Where a single class needs a full profile of its own rather than a line in a table, the measurement is planned with our phosphatidylethanolamine analysis and phosphatidylinositol analysis routes, kept on the same extraction so the class values remain comparable.
A lysophospholipid is a phospholipid that has lost one acyl chain, and its level separates a native lecithin from a hydrolysed one.
| Parameter | What It Indicates | Reported As |
|---|---|---|
| Lysophosphatidylcholine | The main hydrolysis product of phosphatidylcholine and the usual marker of a hydrolysed grade | Content per species, with the declared grade of the material stated |
| Lysophosphatidylethanolamine | Formed from phosphatidylethanolamine and more prominent in some sources than in others | Content per species, reported beside the parent class |
| Lyso-to-parent ratio | Whether a change came from the process or from storage, since hydrolysis continues after manufacture | Ratio, compared against a day-zero sample from the same batch |
| Free fatty acid | The acyl chain released by the same hydrolysis, and a constituent of the material by design in a modified grade | As the free acid, which is a different analyte from the esterified form measured in a class panel |
The choline-containing side is covered in more detail on our lysophosphatidylcholine analysis route, while the class values on this page keep the parent and the lyso form on one report.
A lecithin is not only phospholipid, and the fraction around it sets the basis on which the class percentages are calculated.
| Fraction | What It Indicates | Reported As |
|---|---|---|
| Acetone-insoluble matter | The classical measure of the phospholipid-rich part, which also counts glycolipids and is not the same as the sum of classes | As a percentage, with the definition used stated in the report |
| Residual oil and neutral lipid | The oil left in the material, which separates a fluid grade from a deoiled one | As a percentage, from the same extraction as the class values |
| Free fatty acid | Acidity carried over from the starting oil or produced by hydrolysis during storage | As the free acid content, with the calculation basis recorded |
| Sterols and glycolipids | Plant sterols from the source oil and glycolipids that co-purify with the phospholipid fraction | Content per class where required, otherwise reported as a combined fraction |
Where the sterol or glycolipid side needs its own profile, it is handled through our glycolipid analysis and phytosterol analysis routes so that the whole composition is accounted for.
The acyl chains of the phospholipid fraction carry the unsaturation that governs oxidation and the nutritional claim attached to the material.
| Parameter | Why It Matters | Reported As |
|---|---|---|
| Chain length distribution | Separates a material rich in saturated chains from one carrying longer unsaturated chains | As mass or area percent per chain |
| Degree of unsaturation | The main predictor of how quickly the material oxidises in storage | As the proportion of saturated, monounsaturated, and polyunsaturated chains |
| Source markers | The acyl pattern differs between soy, sunflower, and rapeseed, so it can corroborate a declared source | As a profile, compared against the pattern of the declared oil |
| Trans and conjugated species | Relevant where the material has been heated or chemically modified rather than only degummed | Reported where the process makes them plausible |
The acyl side is resolved with our fatty acid profiling route when the chain distribution is the question, and the result is reported separately from the class composition.
The four groups are reported against one sample identifier, which is what allows a class value and an acyl value to be read as statements about the same material rather than as two unrelated measurements.
A lecithin composition figure is only meaningful together with three pieces of context: where the material came from, which grade it is, and how the number was obtained. Two laboratories can analyse the same sample and report different class contents without either being wrong, because the methods do not measure the same thing.
| What Is Reported | What Changes It | What Must Accompany the Value |
|---|---|---|
| A class content, such as a phosphatidylcholine percentage | The source oil, since soy, sunflower, rapeseed, and egg differ, and the method, because a nuclear magnetic resonance measurement reports mole percent from an internal standard while a detector reports mass percent from a calibration | The source, the grade, the method, and whether the figure is mass or mole percent |
| Acetone-insoluble matter | Whether the figure counts glycolipids and other acetone-insoluble material as well as phospholipid, and how thoroughly the material was deoiled | The definition used, because the same sample gives a higher figure under the broader definition |
| Lysophospholipid level | The grade, whether native, hydrolysed, or fractionated, and the storage history, because hydrolysis continues after manufacture | Whether the product is declared hydrolysed, and the time point the sample represents |
| Residual oil and neutral lipid | The degumming route taken and whether the material was deoiled afterwards | The basis on which the class percentages were calculated |
The method question is not a formality. 31P-NMR is quantitative by construction, because each phosphorus nucleus gives one signal and the molar amount follows from the peak area against a single internal standard, but it reports the class and not the species.
A chromatographic detector separates the classes and reports them by mass, but every class needs its own response relationship and lysophospholipids are easily lost on the column. Mass spectrometry resolves the individual species inside a class and offers the greatest sensitivity, but turning a species signal into a class amount relies on assumptions the other two methods do not need.
The source and the process are the other half of the story. Water degumming removes the easily hydratable classes such as phosphatidylcholine and phosphatidylinositol, while phosphatidylethanolamine and phosphatidic acid need acid or an enzyme, so the same oil can yield lecithins with different class ratios depending on the route taken. Enzymatic modification then converts part of the phosphatidylcholine to its lyso form by design, which is a grade difference rather than a defect.
Two things follow for how a lecithin result is read. First, a value is compared against a figure obtained the same way, not against a number from a different method. Second, the grade and the source are stated with the result, because a hydrolysed sunflower lecithin and a native soy lecithin are not the same material and their numbers should not be placed side by side.
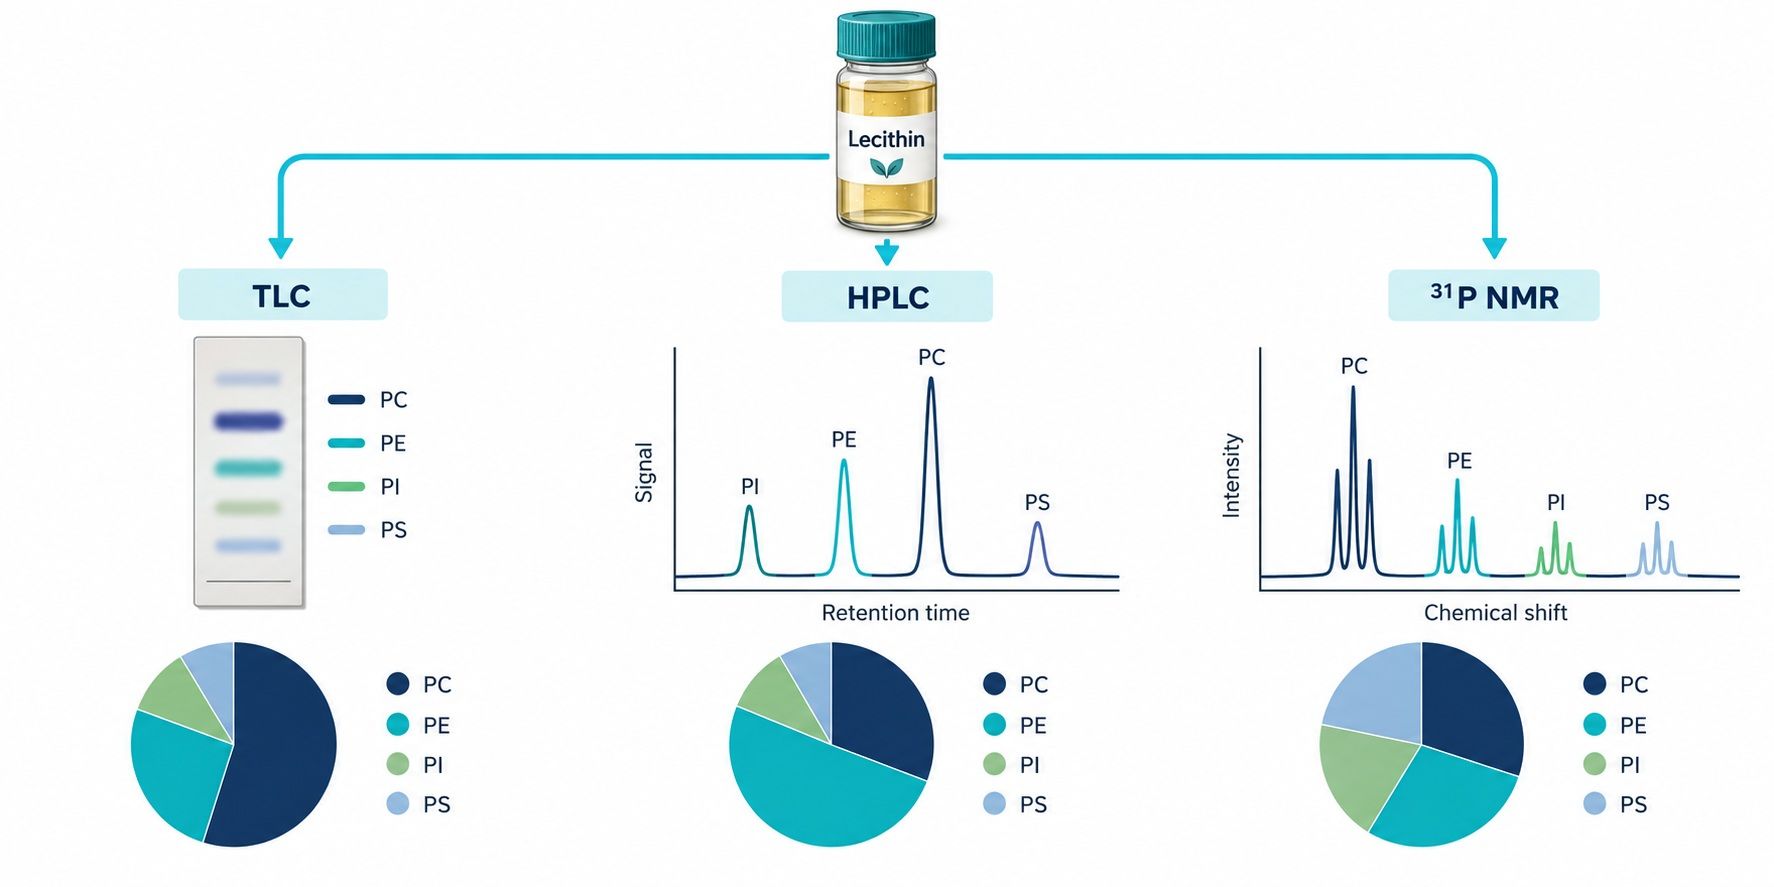 Why a Lecithin Composition Depends on the Method: a single sample split into three parallel routes, thin-layer chromatography, high-performance liquid chromatography with a detector, and phosphorus-31 nuclear magnetic resonance, each returning a different class composition for the same material.
Projects reaching this service differ in the part of the specification the decision depends on, and in whether the comparison is against a declaration, a candidate material, or an earlier time point. Designs outside the patterns below are adapted during feasibility review.
Ingredient Specification and Incoming Verification
Check that a delivered lecithin matches what was ordered, on class content, grade, and the non-phospholipid fraction, so a supplier or lot change is caught before it reaches a product.
Formulation and Emulsifier Selection
Compare candidate lecithins on the composition that governs emulsifying behaviour, including the class ratio and the lysophospholipid level, and select on measurement rather than on a supplier data sheet.
Process Development and Degumming Control
Follow how the class profile and the non-phospholipid fraction change across a degumming or modification step, which is how a process change is connected to the material it produces.
Stability and Storage Studies
Track lysophospholipid and free fatty acid levels across storage or accelerated conditions, since hydrolysis continues slowly and the change is not visible in the appearance of the material.
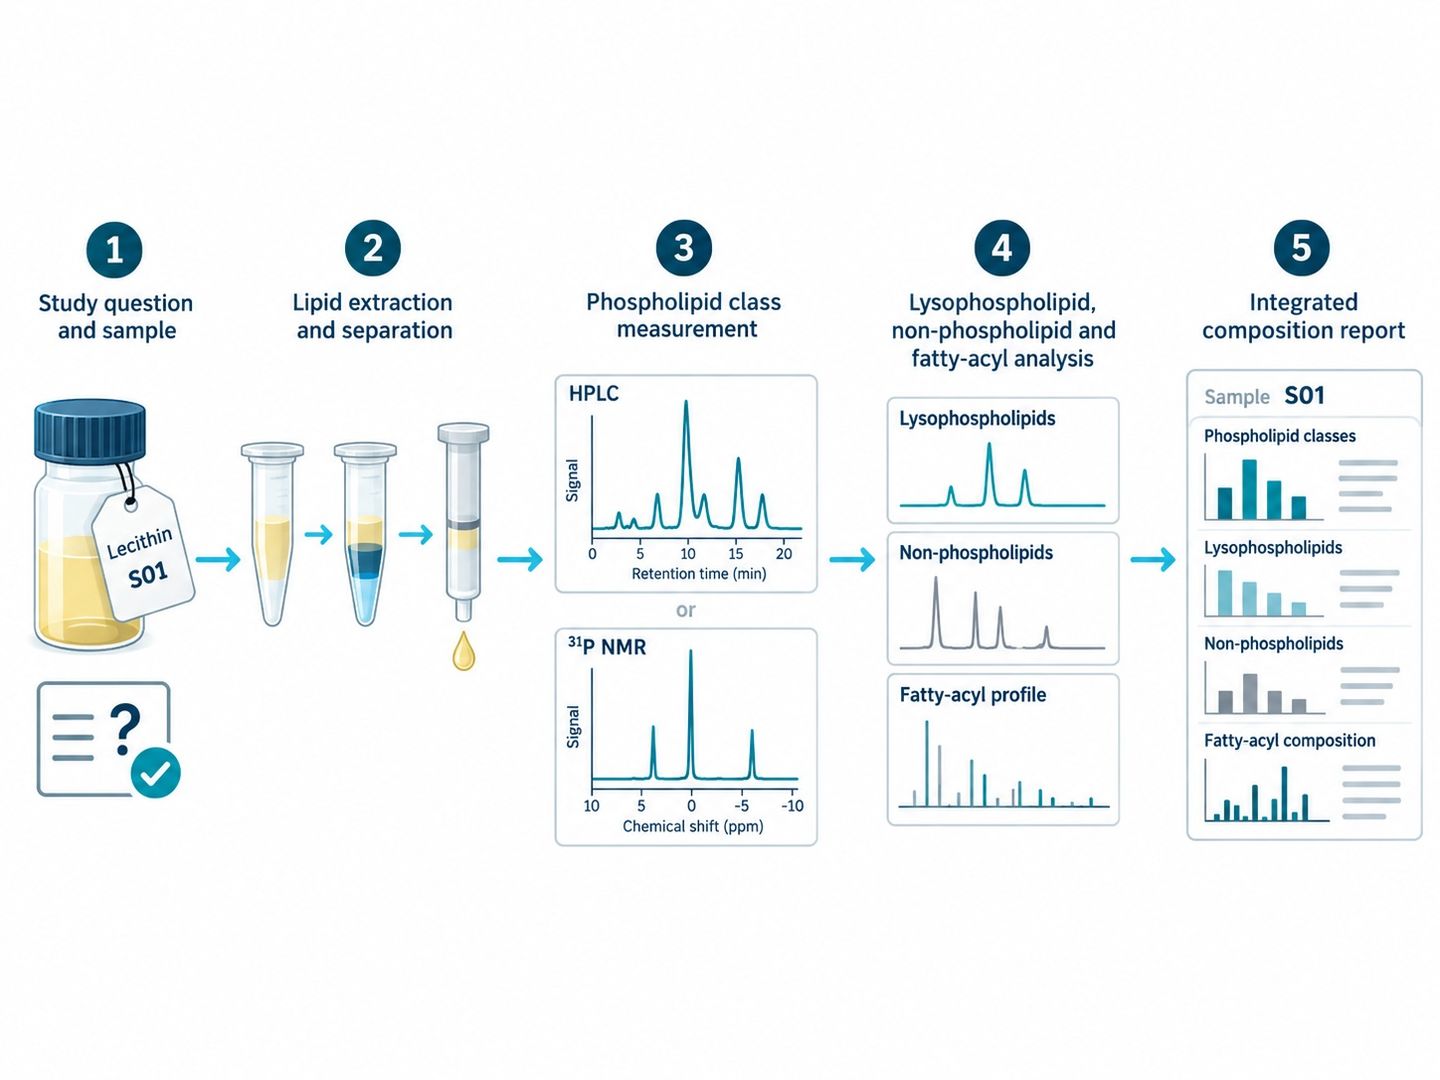 Five-step lecithin composition workflow: review of the figure the project depends on, sample preparation and fraction separation, class composition by nuclear magnetic resonance or chromatography, lysophospholipid and non-phospholipid fraction analysis, and reporting of all values against one sample identifier.
The workflow is modular, and one decision shapes it: which figure the project is built around. A specification check needs the class content, the acetone-insoluble matter, and the grade markers; an emulsifier comparison needs the class ratio and the acyl profile; a stability question needs the lysophospholipid and free fatty acid levels against a day-zero sample.
Fixing that first decides the extraction and the method, because a preparation used for a chromatographic class separation is not the one used for a nuclear magnetic resonance measurement, and the two do not report the same kind of number.
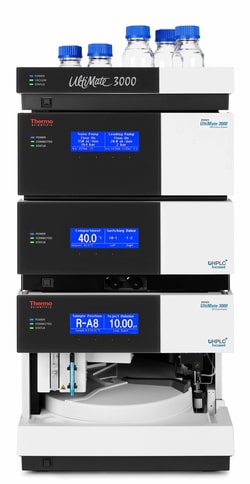
Thermo Scientific UltiMate 3000 (Figure from Thermo Fisher) — separation of phospholipid classes before detection
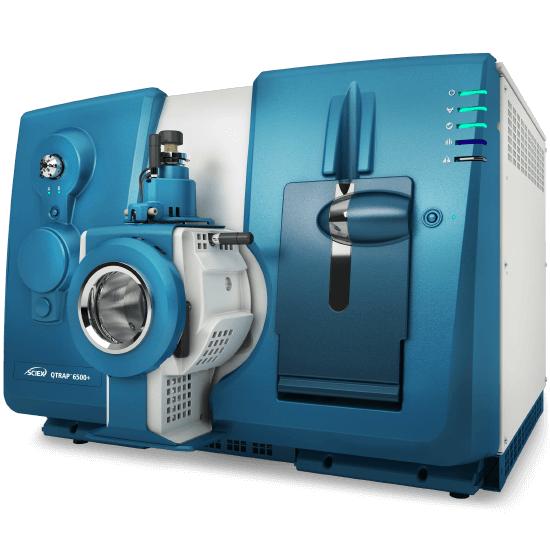
SCIEX Triple Quad 6500+ (Figure from SCIEX) — scheduled MRM for lysophospholipids and species-level phospholipid detail
| Parameter | Specification |
|---|---|
| Sample preparation | The material is dispersed and extracted so that the phospholipid and the non-phospholipid fractions are separated before either is measured |
| Class composition | A quantitative phosphorus-31 nuclear magnetic resonance measurement from a single internal standard, used where a class figure is needed without a calibration per class |
| Chromatographic separation | Normal-phase or hydrophilic interaction separation of the classes, with charged aerosol or light scattering detection for class-level amounts |
| Species detail | Mass spectrometry inside a class, used where the acyl composition or one defined species is the question rather than the class total |
| Acyl profile | Gas chromatography of the fatty acid methyl esters from the phospholipid fraction, reported for chain length and unsaturation |
| Grade markers | Lysophospholipids and free fatty acids measured on the same extraction, so a hydrolysed grade can be distinguished from a native one |
| Non-phospholipid fraction | Acetone-insoluble matter, residual oil, and neutral lipid determined separately from the class analysis and reported on their own basis |
| Quantitation basis | Mass percent, mole percent, or a ratio, with the calibration, the internal standard, and the recovery stated for every value |
| Comparison design | Source, grade, or process variants run as one batch, so a difference is attributed to a defined variable rather than to run-to-run variation |
The core report places the phospholipid classes, the hydrolysis markers, the non-phospholipid fraction, and the acyl profile on one structure, so a material can be read as a whole rather than attribute by attribute.
Key Features:
Raw instrument files can be discussed during project planning when they are needed for archiving or independent review.
The class-level figures reported here sit inside our wider phospholipid analysis platform, where the same measurements are applied to membrane, formulation, and ingredient studies.
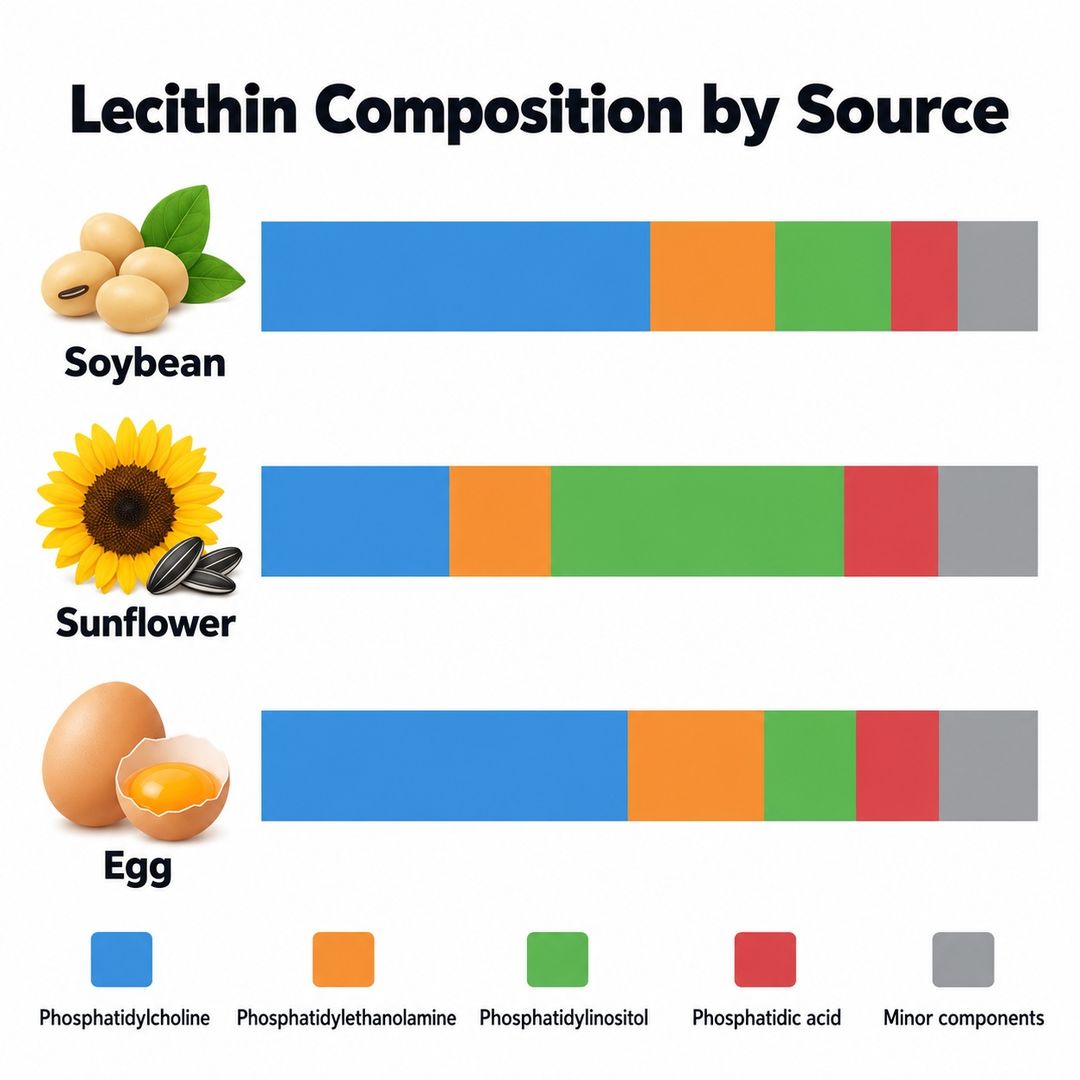
Class composition placed side by side for three source materials, showing how phosphatidylinositol separates a sunflower material from a soy one.
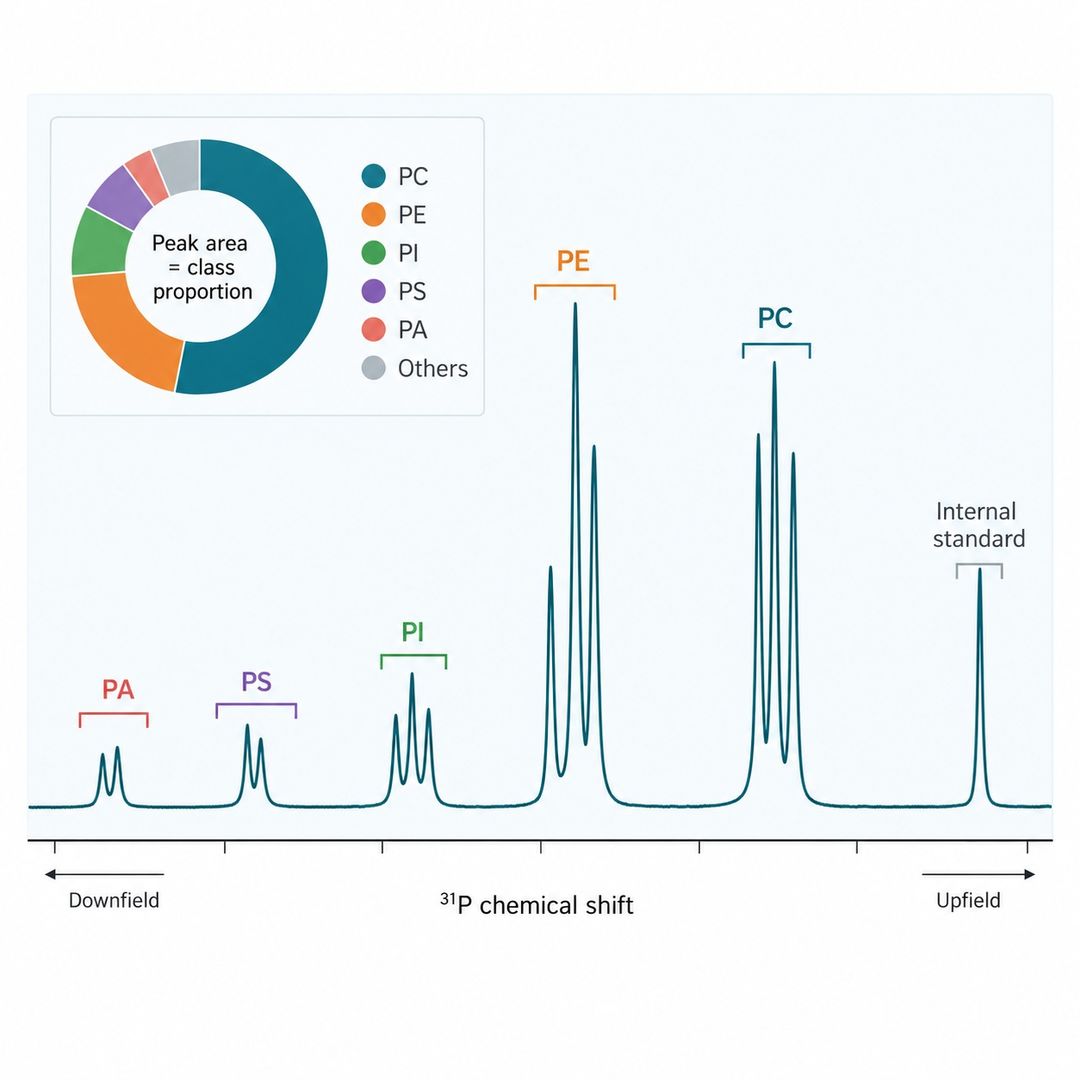
An annotated phosphorus-31 spectrum with the class signals identified, which is the form in which a quantitative class composition is obtained.
Where the decision concerns the specification itself, the deliverable is a class table built so that it can be placed directly beside a declaration or a second material.
Key Features:
Where the question concerns hydrolysis, the deliverable separates what the material was made as from what has happened to it since.
Key Features:
| Sample Type | Collection and Handling | Typical Starting Amount | Planning Notes |
|---|---|---|---|
| Fluid lecithin | Ship in a sealed container at ambient temperature, protected from light and air, and record the lot and the date of manufacture | 10 grams or more | State the declared grade so that a raised lysophospholipid level can be read against what the material was intended to be |
| Deoiled or powdered lecithin | Store sealed and dry, and avoid repeated opening of the container before analysis | 5 to 10 grams | A powder carries less residual oil than a fluid grade, so the class percentages are calculated on a different basis |
| Hydrolysed or modified grade | Provide the material unopened and record the modification route and the date of manufacture | 10 grams or more | The lyso content is expected to be elevated, so the result is interpreted against the declared route rather than against a native material |
| Raw oil or degumming intermediate | Keep each step cold and process promptly, since the phospholipid profile continues to change after the step is complete | 20 millilitres or more per step | Sampling at the step itself is what allows a change in the finished material to be attributed to a defined operation |
| Stored or stressed samples | Provide the time point and the stress condition for each sample, and store unopened until analysis | 5 grams or more per time point | Time points from the same batch are compared against each other, so the day-zero sample belongs to the set rather than being a separate request |
| Reference material for source comparison | Provide the same amount as the unknown sample, with the source and grade documented | 10 grams or more per reference | A source question is answered by comparison, so the reference materials are part of the design rather than a later addition |
The amounts above are planning figures. Final quantities are confirmed once the figure set has been agreed, because a class composition and a full project including the acyl profile and the non-phospholipid fraction do not carry the same requirement.
Which method should I choose for a lecithin composition analysis?
The choice follows from the figure you need. A quantitative phosphorus-31 nuclear magnetic resonance measurement gives the class composition from one internal standard and needs no calibration curve per class, which suits a specification check. Liquid chromatography with charged aerosol or light scattering detection separates the classes and reports them by mass, which suits a comparison between materials. Mass spectrometry gives species-level detail inside a class, which suits a question about the acyl composition. The three do not return identical numbers, so the method is named in the report and a comparison is made against data obtained the same way.
What is the difference between a native and a hydrolysed lecithin?
A native lecithin keeps its two-chain phospholipids, while a hydrolysed grade has had one acyl chain removed from part of the phosphatidylcholine by enzymatic treatment, leaving lysophosphatidylcholine and a free fatty acid. Hydrolysis also continues slowly during storage, so a raised lysophospholipid level can mean the material was made that way or that it has aged. The declared grade is therefore recorded with the result, and where the question concerns the material rather than its history, a day-zero sample from the same batch is included for comparison.
Can the analysis tell which oil a lecithin came from?
Partly. The class ratio and the acyl profile both differ between soy, sunflower, rapeseed, and egg, and phosphatidylinositol is usually higher in a sunflower material than in a soy one. That makes the composition consistent with a declared source, but composition alone does not establish origin, because processing and blending move the same figures. Where source is the question, the measurement is designed as a comparison against reference materials from known sources rather than as a single sample.
Does the analysis include the non-phospholipid fraction?
Yes, and it is reported separately. Acetone-insoluble matter, residual oil, free fatty acids, plant sterols, and glycolipids are measured alongside the phospholipid classes, because a class percentage is calculated against a defined fraction and means little without it. A fractionated product and a fluid lecithin can carry the same phosphatidylcholine percentage on very different bases, and the non-phospholipid figures are what make that difference visible.
How should a lecithin sample be collected and shipped?
Send the material as it is used, whether fluid, deoiled, or granulated, sealed and protected from oxygen, light, and heat. Around 10 grams is a workable starting amount for a class composition plus the non-phospholipid fraction, and less is enough where only the acyl profile is needed. Record the lot, the supplier, the declared grade, and the date of manufacture, because hydrolysis continues after manufacture and the time point the sample represents is part of the result.
Is this service for clinical diagnostic use?
No. This service is for research and development use only. It is not intended for clinical diagnostic procedures, patient management, or treatment decisions, and no result is reported as a clinical index or as a release decision. The materials evaluated here are research or industrial samples rather than clinical specimens.
What information is needed for a quote?
Provide the material together with its declared source and grade, the figures the decision depends on, and the number of samples. Add the comparison the data has to support, such as two suppliers, two grades, or a set of storage time points, because a specification check and a stability comparison are designed differently. Mention any known deviation from the declaration, such as a blend or a non-standard oil, since that changes which reference the result is read against.
References
Services:
Online Inquiry
CONTACT US