Fatty Acid Profiling
Detailed quantification of fatty acid composition in biological samples, including tissues, plasma, serum, and oils. We provide insights into saturated, unsaturated, and trans fatty acid content.
Our services have earned the trust of companies, schools, and organizations globally, and we remain dedicated to maintaining that trust.
Fatty acids are crucial building blocks of lipids, consisting of a carboxyl group and a long hydrocarbon chain. They are essential for energy production, cell membrane structure, and cellular signaling. According to the carbon chain length, fatty acids can be divided into short-chain fatty acids (2-4 carbon atoms), medium-chain fatty acids (6-12 carbon atoms) and long-chain fatty acids (more than 14 carbon atoms).
Fatty acids serve as primary energy sources, stored as triglycerides in adipose tissue. They are involved in forming phospholipids, which make up cell membranes, and regulate various biological processes such as inflammation and cell signaling. The balance of different fatty acid types significantly impacts overall health and disease prevention.
At Creative Proteomics, we offer comprehensive fatty acid analysis services tailored to meet the unique needs of researchers, clinicians, and industry professionals. Our services cover a wide range of fatty acid profiles and molecular data to facilitate in-depth analysis.

Fatty Acid Profiling
Detailed quantification of fatty acid composition in biological samples, including tissues, plasma, serum, and oils. We provide insights into saturated, unsaturated, and trans fatty acid content.

Free Fatty Acid (FFA) Measurement
Accurate analysis of free fatty acids in various biological matrices to support metabolic studies and nutritional assessments.

Fatty Acid Methyl Ester (FAME) Analysis
Characterization of fatty acid methyl esters through advanced gas chromatography (GC) techniques to determine the fatty acid profile.

Comprehensive analysis of complex lipids and lipid classes to investigate lipid metabolism, signaling, and membrane integrity.

Trans Fatty Acid Detection
Sensitive detection and quantification of trans fatty acids, which have significant implications in health, particularly cardiovascular disease.

Fatty Acid Oxidation Studies
Quantifying metabolites of fatty acid oxidation to understand metabolic dysfunctions, particularly in metabolic diseases like diabetes and obesity.
Saturated fatty acids are crucial components of lipids that do not contain double bonds between carbon atoms. They are commonly found in animal fats, dairy products, and certain plant oils.
These fatty acids contain one or more double bonds between carbon atoms. They are generally liquid at room temperature.
Monounsaturated Fatty Acids (MUFA) (One Double Bond)
Polyunsaturated Fatty Acids (PUFA) (Multiple Double Bonds)
These are unsaturated fatty acids with at least one trans double bond, typically found in partially hydrogenated fats. Trans fats are linked to cardiovascular diseases and metabolic disorders. We provide accurate trans fatty acid analysis to help assess their presence in diets and their impact on health, especially in processed foods.
These fatty acids have a branched hydrocarbon chain, often found in certain bacteria, plants, and foods. Branched-chain fatty acids are important biomarkers in metabolic and microbial research. Their presence can indicate microbial activity or metabolic disturbances.
Hydroxy fatty acids contain one or more hydroxyl groups (-OH), which impart distinctive biochemical properties. These fatty acids are often involved in signaling pathways, inflammation processes, and as intermediates in lipid biosynthesis.
Oxidized fatty acids are the products of lipid peroxidation. They play a role in cellular signaling, inflammation, and oxidative stress. They are important biomarkers in aging, cardiovascular diseases, and neurodegenerative disorders.
These fatty acids are involved in bioactive roles in metabolism, inflammation, and disease modulation. They include precursors of various lipid mediators, such as endocannabinoids, prostaglandins, and leukotrienes.
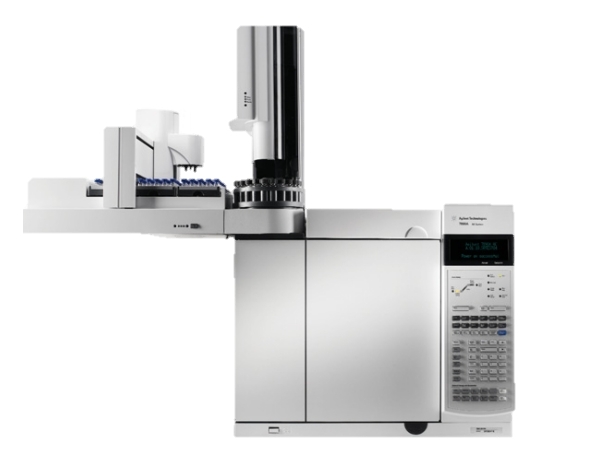
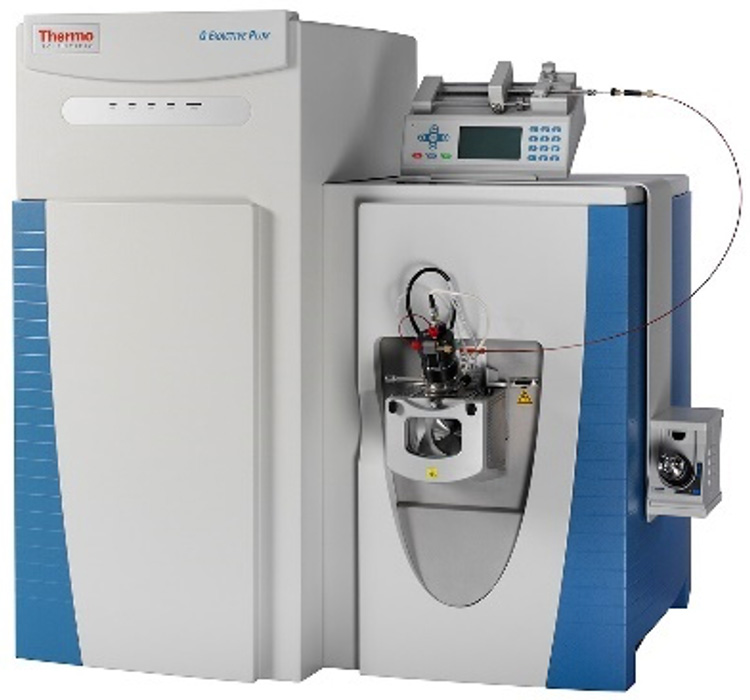
At Creative Proteomics, we offer two advanced techniques for fatty acid analysis: Gas Chromatography with Flame Ionization Detection (GC-FID) and Gas Chromatography-Mass Spectrometry (GC-MS). These methods are highly effective for profiling fatty acids in a variety of biological, food, and environmental samples. GC-FID provides reliable, high-throughput quantification, while GC-MS offers in-depth identification and detailed analysis of fatty acid composition, including isomers and derivatives. Our cutting-edge instruments ensure precise, accurate results tailored to your research needs.
| Feature | GC-FID | GC-MS |
|---|---|---|
| Sensitivity | High sensitivity for fatty acid quantification | Very high sensitivity and specificity for both identification and quantification |
| Quantification | Excellent for quantitative analysis | Accurate for both quantitative and qualitative analysis |
| Identification | Primarily for quantification; limited to fatty acid methyl esters | Excellent for identifying individual fatty acids and their isomers |
| Complexity | Simpler, faster, and more cost-effective | More complex, time-consuming, but offers detailed analysis |
| Applications | Routine fatty acid profiling, food and oil analysis | Advanced fatty acid and lipidomic profiling, metabolomics, environmental studies |

Agilent 7890A GC System (Figure from Agilent)

Thermo Fisher Q Exactive (Figure from Thermo Fisher)
Results we provide:
Data analysis:
Results provided:
Data insights:
Results provided:
Data insights:
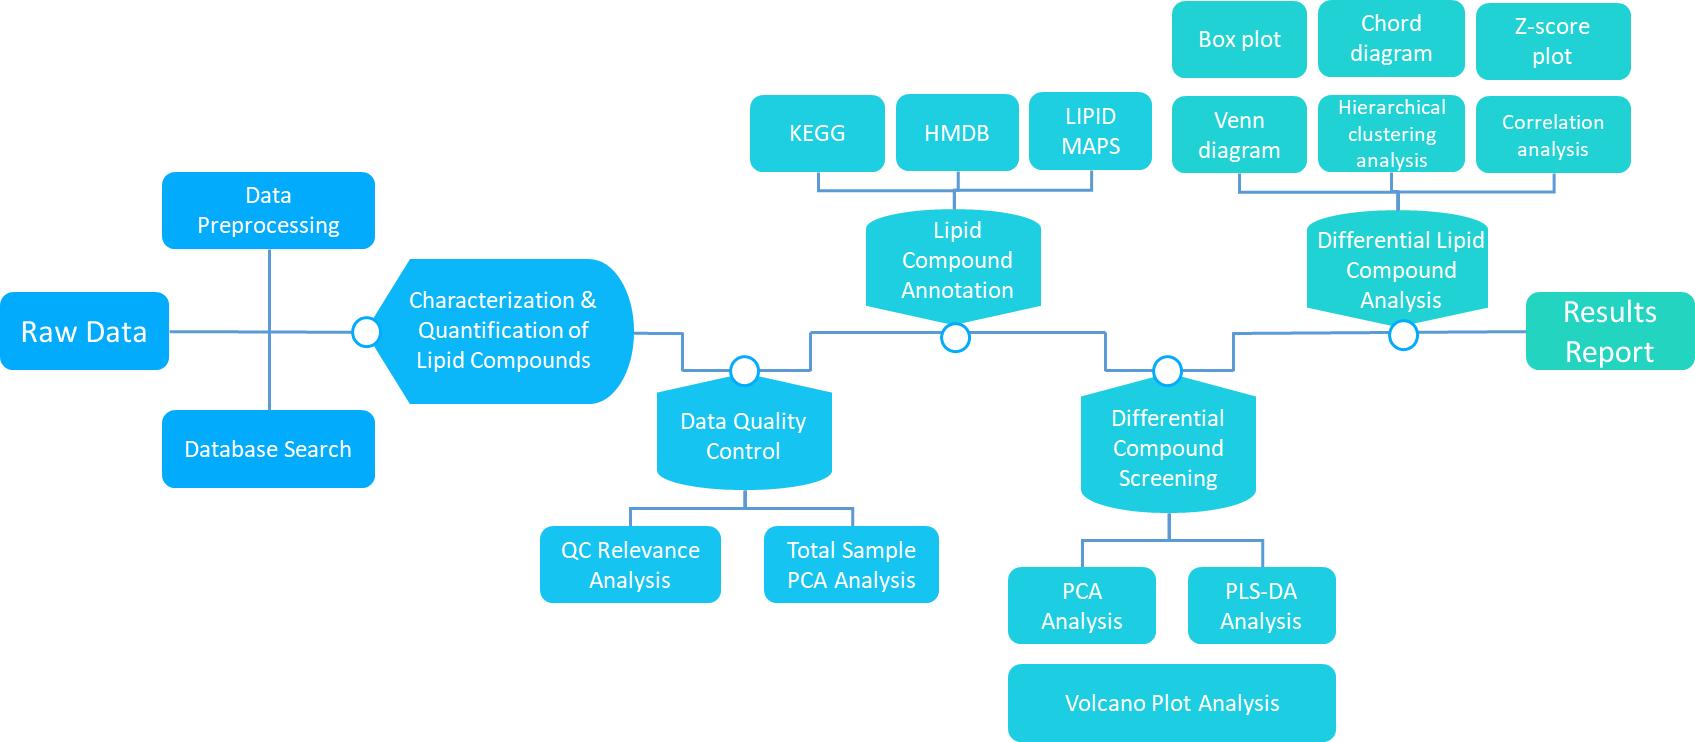
 Workflow of Lipidome Data Analysis
Explore our Lipidomics Solutions brochure to learn more about our comprehensive lipidomics analysis platform.


Metabolic Research
Understanding lipid metabolism and metabolic disorders by analyzing fatty acid profiles and their role in energy production and storage.

Disease Research
Identifying fatty acid biomarkers linked to diseases like cardiovascular conditions, cancer, and neurodegenerative disorders.

Nutrition and Diet
Studying the effects of dietary fats on health and their role in preventing diseases through detailed fatty acid composition analysis.

Inflammation and Cell Signaling
Investigating the involvement of fatty acids in inflammatory responses and cellular signaling pathways relevant to disease processes.

Drug Development
Monitoring fatty acid changes in response to treatments to assess drug efficacy and identify biomarkers for therapeutic targets.

Environmental Studies
Assessing the impact of environmental factors, such as pollution or dietary changes, on fatty acid composition in organisms.
| Sample Type | Sample Amount | Preparation | Recommended Storage | Additional Notes |
|---|---|---|---|---|
| Blood Plasma | 1–5 µL | Centrifuge to separate plasma | –80°C or Liquid Nitrogen | Avoid contamination with lipids. |
| Serum | 1–5 µL | Centrifuge to separate serum | –80°C or Liquid Nitrogen | Store immediately after collection. |
| Tissues | 10–100 mg | Homogenize in cold solvent (e.g., methanol) | –80°C or Liquid Nitrogen | Fresh tissue preferred. |
| Cell Lysates | 50–100 µL | Lyse cells in cold buffer or solvent | –80°C or Liquid Nitrogen | No protease inhibitors. |
| Plasma/Serum Extracts | 1–5 µL | Filter and extract using lipid extraction protocols | –80°C or Liquid Nitrogen | Follow recommended extraction protocols. |
| Food Samples | 50–100 mg | Homogenize in cold solvent (e.g., chloroform/methanol) | –80°C or Liquid Nitrogen | Avoid contamination during processing. |
| Milk/Other Body Fluids | 50–100 µL | Centrifuge and collect supernatant | –80°C or Liquid Nitrogen | Ensure no microbial contamination. |
| Fecal Samples | 50–100 mg | Homogenize with solvent for lipid extraction | –80°C or Liquid Nitrogen | Quick processing is recommended. |
Can fatty acid analysis detect isomers and derivatives?
Yes, both GC-FID and GC-MS methods allow for the detection and quantification of fatty acid isomers and derivatives. GC-MS, in particular, offers high specificity for identifying individual fatty acids, including those with structural variations like double bonds or hydroxy groups, as well as any oxidation products or trans isomers.
Can fatty acid analysis be performed on complex samples like food or environmental specimens?
Yes, we can analyze fatty acids in a wide variety of complex samples, including food products, oils, and environmental specimens (e.g., water, soil, and organisms). Proper sample extraction methods are crucial to ensure reliable fatty acid profiling, and we provide specific protocols for these types of samples to ensure the best results.
How long will it take to receive my results?
The typical turnaround time for fatty acid analysis is between 2-4 weeks, depending on the complexity of the analysis and the number of samples. If you have urgent timelines, we offer expedited services, and our team will work with you to meet your deadlines without compromising quality.

Reference
Services:
Resource:
Platform:
Online Inquiry
CONTACT US