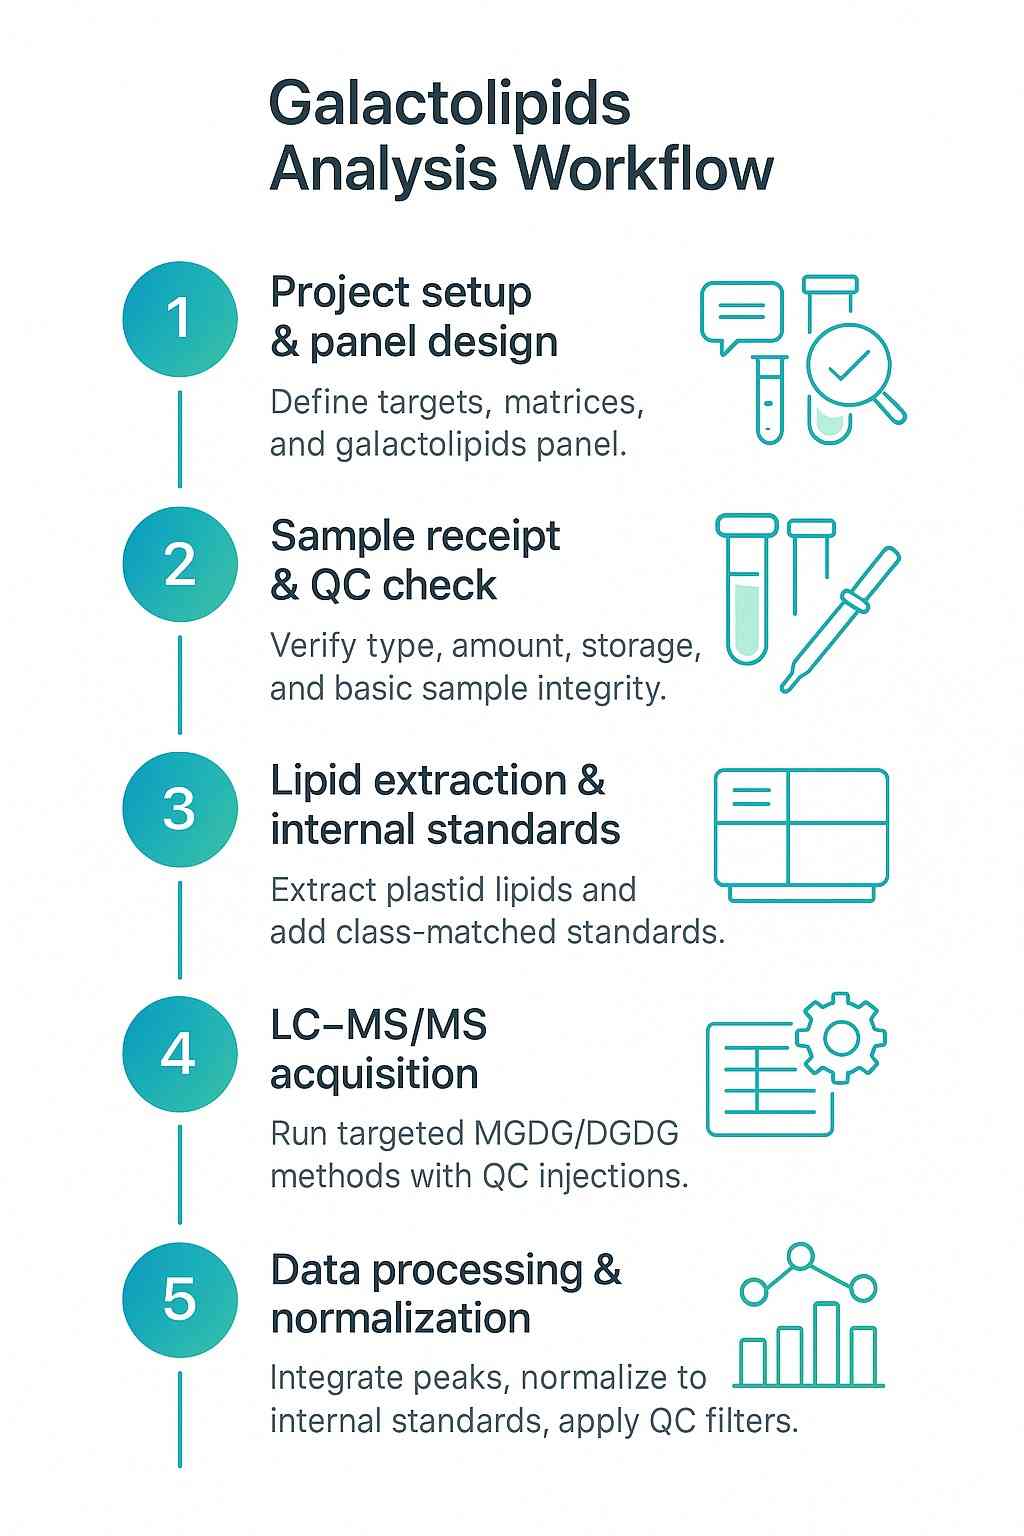
Targeted MGDG/DGDG Quantification
- Absolute or relative quantification of major MGDG and DGDG species across plant, algal, and microbial samples
- Focus on molecular species relevant to photosynthetic efficiency and stress tolerance
Galactolipids such as MGDG and DGDG are sensitive indicators of chloroplast membrane status, photosynthetic efficiency, and plant or algal stress responses. Creative Proteomics provides a dedicated galactolipids analysis service using LC–MS/MS workflows optimized for chloroplast-rich matrices, helping you quantify MGDG/DGDG remodeling, profile key plastid glycolipids, and translate lipid changes into clear biological conclusions.
Submit Your Request Now
×


Galactolipids are glyceroglycolipids carrying one or two galactose residues on a diacylglycerol backbone. In most photosynthetic organisms, MGDG and DGDG replace phospholipids as the major bilayer-forming components in thylakoid membranes, conserving phosphate and stabilizing photosystem complexes.
Quantifying galactolipids is important when you want to:
A dedicated galactolipids assay lets you move beyond total "chloroplast lipid" measurements and quantify exactly which molecular species and ratios change in your system.
Targeted MGDG/DGDG Quantification
Extended Galactolipids and Sulfolipids Panel
MGDG:DGDG Ratio and Saturation Profiling
Galactolipid Remodeling under Stress
For discovery-stage studies where you first want to screen the full lipidome and then follow up with targeted galactolipids, this service can be paired with our Untargeted lipidomics profiling.
Our galactolipids panel is configurable by organism, tissue, and research question. Below is a representative panel commonly used in plant and algal projects, based on LC–MS/MS libraries reported for MGDG and DGDG profiling.
Galactolipid Classes and Representative Molecular Species
| Class / Group | Representative Species and Notes* |
|---|---|
| MGDG (monogalactosyldiacylglycerols) | MGDG 32:x–44:x series (e.g., 34:3, 34:6, 34:7, 36:5, 36:6); combinations of 16:0/18:3, 16:3/18:3, 18:3/18:3, and other plastidial fatty acids |
| DGDG (digalactosyldiacylglycerols) | DGDG 32:x–44:x series (e.g., 34:3, 34:6, 34:7, 36:6); species enriched in chloroplast envelope and extraplastidic membranes |
| Acylated MGDG / DGDG | Oxidized and acyl-galactolipids associated with stress and signaling; availability depends on standards and method scope |
| Lyso-galactolipids | Lyso-MGDG and lyso-DGDG species generated during membrane turnover or phospholipase activity |
| SQDG (sulfoquinovosyldiacylglycerols) | SQDG 32:x–44:x species; important anionic sulfolipids in thylakoid membranes |
| Associated phospholipids (optional) | PG, PC, PE species measured alongside galactolipids to track membrane remodeling |
* The exact panel and quantifiable species depend on sample type, concentration, and reference standards. For specialized needs (e.g., unusual algal species or engineered lines), we can discuss custom transitions and validation scope.
For projects that need broader coverage of sugar-containing lipids beyond galactolipids, you can extend this assay with our Glycolipids Analysis Service.
For projects that require coordinated quantification of galactolipids together with phospholipids, neutral lipids, or other defined classes, we offer complementary targeted lipidomics panels.
Our galactolipids assays are built on established LC–MS platforms that are widely used in plant and algal lipidomics, combining robust chromatography with sensitive, targeted detection.
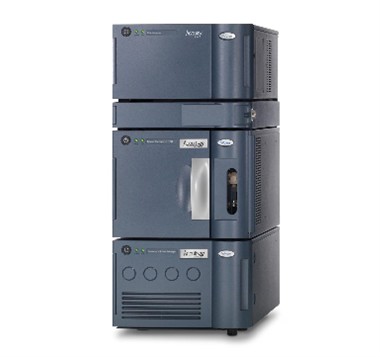
Waters ACQUITY UPLC System (Figure from Waters)
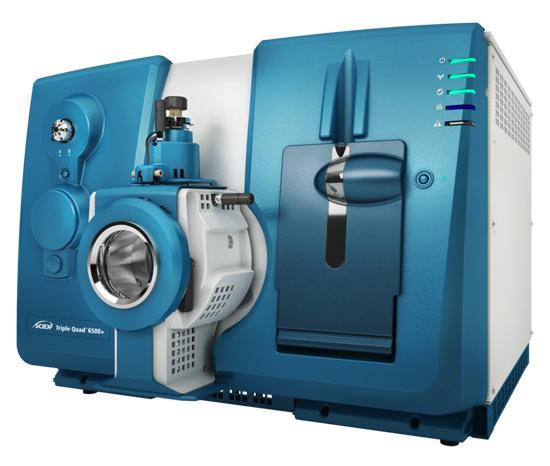
SCIEX Triple Quad™ 6500+ (Figure from Sciex)
Galactolipid result table
QC and calibration summary
Basic plots for quick review
Method summary sheet
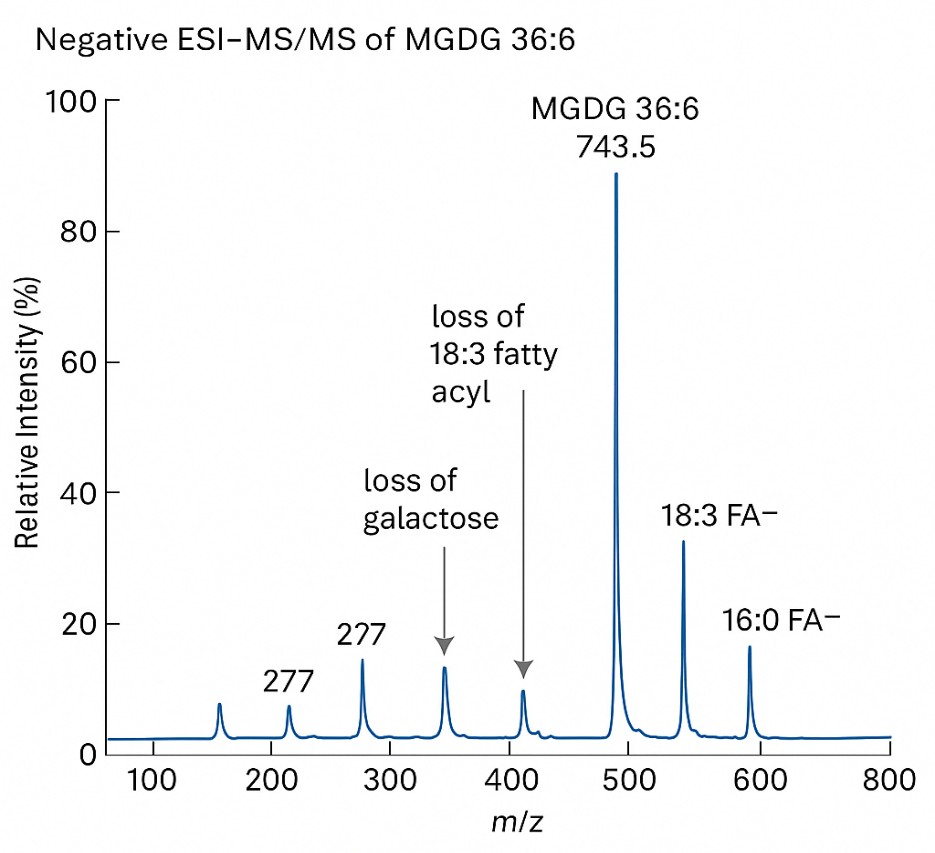
Representative negative ESI–MS/MS spectrum of MGDG 36:6.
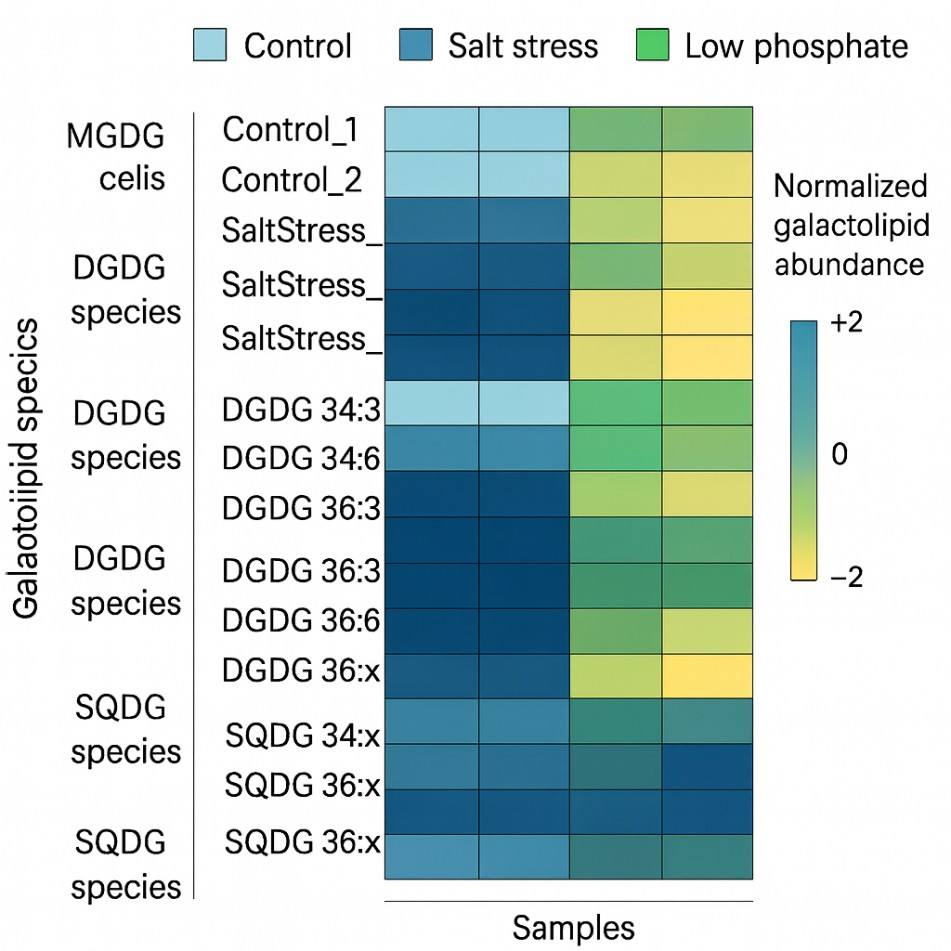
Heatmap of MGDG and DGDG molecular species across treatments.
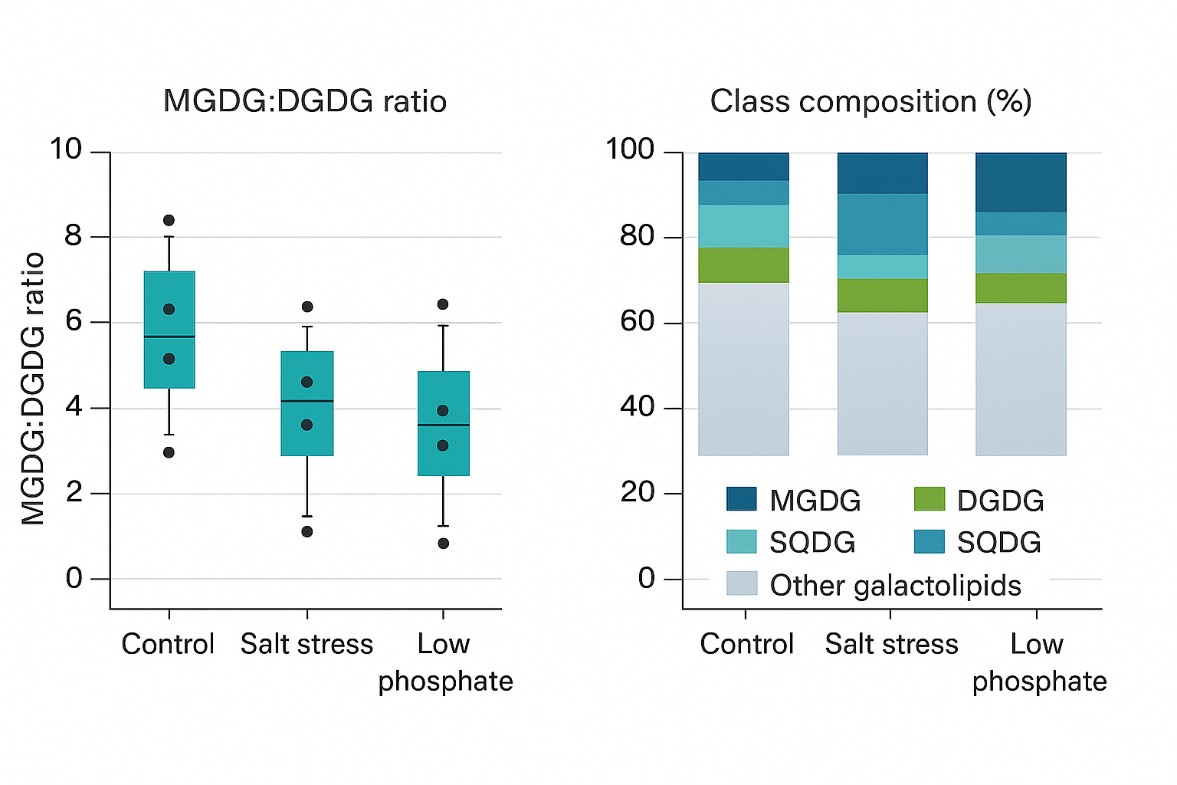
MGDG:DGDG ratios and plastid glycolipid class composition.
Explore our Lipidomics Solutions brochure to learn more about our comprehensive lipidomics analysis platform.

Plant Stress Physiology
Link galactolipid remodeling to salt, drought, cold, or heat stress responses in crops.
Chloroplast and Thylakoid Biogenesis
Study how MGDG and DGDG accumulation supports plastid differentiation and membrane architecture.
Nutrient Use and Membrane Remodeling
Assess how phosphate or sulfur availability alters galactolipids and sulfolipids to maintain photosynthesis.
Algal and Microalgal Biotechnology
Characterize galactolipid profiles in algae and protists for strain selection, cultivation optimization, or bioproduct development.
Food and Nutrition Research
Profile galactolipids in leafy vegetables, microalgae, and plant-based foods to link membrane lipid composition to quality traits.
Comparative and Evolutionary Lipidomics
Compare galactolipid patterns across species or mutants to explore plastid evolution and membrane specialization.
| Sample Type | Minimum Amount | Container & Preservative | Handling & Storage | Shipping Notes |
|---|---|---|---|---|
| Plant leaves / needles | ≥ 50 mg fresh or frozen | Pre-labeled cryovials; no fixatives | Snap-freeze in liquid nitrogen; store at −45 °C, avoid thawing | Ship on dry ice; protect from light where possible |
| Plant roots / stems / seeds | ≥ 50 mg | Cryovials or screw-cap tubes | Snap-freeze; record fresh weight; keep at −45 °C | Ship on dry ice with clear labeling of tissue type |
| Algal or microalgal pellets | Pellet from ≥ 10 mL dense culture | Low-bind tubes | Harvest by cold centrifugation; wash if needed; freeze immediately | Ship frozen on dry ice; include information on growth conditions |
| Cultured plant or algal cells | ≥ 1 × 10⁶ cells | Low-bind tubes | Remove medium, wash with cold buffer, snap-freeze | Ship frozen; indicate approximate cell count and viability |
| Food or biomass samples (e.g., leafy vegetables, algal powders) | ≥ 1 g homogenized material | Sealed polypropylene containers or bags | Freeze promptly after collection; avoid repeated freeze–thaw | Ship on dry ice; specify matrix (e.g., spinach leaves, algal flour) |
If your project has restrictions on additives or preservatives, we can suggest compatible extraction and stabilization strategies during project setup.
What does the MGDG:DGDG ratio tell me?
It reflects thylakoid membrane organization and chloroplast status. Shifts in the ratio often track changes in photosynthetic performance and stress adaptation.
Can galactolipids be analyzed together with other lipid classes?
Yes. We can profile galactolipids alongside SQDG, PG, and other membrane lipids so you see whole-membrane remodeling, not just one class.
How much sample do I need and how should I collect it?
Typical leaf or algal amounts in the sample table are enough. The key is fast quenching (snap-freeze) and avoiding repeated freeze–thaw to protect galactolipids.
Do you support non-model plants or engineered lines?
Yes. We apply a broad galactolipid panel and can fine-tune transitions if your strain produces unusual species.
Are results absolute concentrations or relative values?
For common MGDG and DGDG species we can report calibrated concentrations. Extended panels are usually semi-quantitative but fully normalized for robust group comparisons.
Why not just measure total chloroplast lipids or total fatty acids?
Bulk measurements hide which galactolipid classes and species change. Our assay resolves MGDG, DGDG and SQDG species so you can link specific remodeling events to function.
What QC controls are included?
Each batch includes standards, pooled QCs and blanks. We track retention time, signal drift and variation and flag values outside validated performance ranges.

Services:
Online Inquiry
CONTACT US