Our services have earned the trust of companies, schools, and organizations globally, and we remain dedicated to maintaining that trust.
What Is BMP/LBPA and Why Measure It?
Bis(monoacylglycero)phosphate (BMP)—also known as lysobisphosphatidic acid (LBPA)—is an uncommon but biologically critical phospholipid that accumulates in late endosomes and lysosomes, particularly in the internal membranes of multivesicular bodies. Unlike conventional phospholipids, BMP has a unique sn-1:sn-1' linkage and is structurally distinct from isomeric lipids such as phosphatidylglycerol (PG), which makes it difficult to resolve without targeted methods.
BMP/LBPA plays key roles in:
- Lysosomal membrane remodeling and maintenance of intraluminal vesicles (ILVs)
- Cholesterol export and trafficking through the endolysosomal system
- Endosomal sorting, cargo processing, and lipid storage regulation
- Response to lysosomal dysfunction, including drug-induced phospholipidosis and lipid accumulation disorders
Because of its low abundance, isomeric interference, and tissue-specific regulation, BMP/LBPA is rarely captured well in untargeted lipidomics. Targeted LC–MS/MS assays are essential to:
- Accurately quantify BMP/LBPA species across carbon lengths and unsaturation levels
- Monitor endolysosomal lipid flux in mechanistic and pharmacological studies
- Support interpretation of changes in sphingolipid and ganglioside metabolism
BMP/LBPA Quantification Solutions at Creative Proteomics
At Creative Proteomics, we offer fit-for-purpose BMP/LBPA lipidomics solutions tailored to the unique challenges of this acidic, isomer-rich phospholipid. Whether you're working with lysosomal biology, endosomal trafficking, or lipid metabolism models, our platform provides high-confidence, species-level data to drive your research forward.
Targeted BMP/LBPA Quantification (Species-Resolved Panel)
Quantify BMP/LBPA species by total carbon:double bond composition (e.g., BMP 36:2, 38:4) using scheduled MRM acquisition. Receive species tables, total lipid content, and groupwise distribution summaries
Isomer-Aware Anionic Lipid Cross-Check (Recommended)
Include closely related lipids—PG, PA, and CL—to distinguish true BMP signals from co-eluting species. This step enhances data confidence and helps interpret lipid remodeling more comprehensively.
BMP Add-On to Untargeted Lipidomics
Already performing global lipidomics? We can extend your discovery data with a BMP-focused targeted add-on, using the same extracts and sample IDs, to validate specific BMP/LBPA shifts of interest.
Detectable BMP/LBPA Species in Our Targeted LC–MS/MS Panel
Our assay detects a broad range of BMP/LBPA species across total carbon and unsaturation levels. The table below shows commonly monitored species, grouped by carbon chain category. Additional targets are available upon request.
Species-Level Panel Overview
| Carbon Range | Detected Species (Total C:Double Bonds) | Typical Notes |
|---|
| C32–C34 | 32:0, 32:1, 32:2
34:0, 34:1, 34:2, 34:3 | Enriched in early endolysosomal membranes |
| C36–C38 | 36:0, 36:1, 36:2, 36:3, 36:4
38:1, 38:2, 38:3, 38:4, 38:5 | Dominant BMP species in mammalian cells and tissues |
| C40–C44 | 40:1 to 40:6
42:1 to 42:8
44:2 to 44:10 | Longer-chain species, often detected in neurons or oxidative stress models |
Format: All species are reported as BMP X:Y, where X = total carbon atoms and Y = total double bonds.
Optional Add-On Targets
| Add-On Module | Description |
|---|
| Lyso-BMP (monoacyl forms) | For specific applications or when monoacylated forms are needed |
| PG / PA / CL cross-panel | Helps confirm BMP identity and resolve co-eluting anionic isomers |
| Custom species panel | Based on untargeted discovery or project-specific pathway hypotheses |
Why Choose Our BMP/LBPA Assay
- Isomer-Aware Method Design
Differentiates BMP from co-eluting anionic lipids such as phosphatidylglycerol (PG) using retention time validation and qualifier transitions.
- Scheduled MRM for Low-Abundance Sensitivity
Ensures sufficient dwell time and signal stability, even for minor BMP species in low-lipid samples.
- Class-Specific Internal Standards
Applies BMP analogs or validated surrogates to anchor normalization and improve between-batch comparability.
- Quantitative Performance You Can Trust
Assay linearity ≥ R² 0.99, with CV ≤ 15% across QC samples. Drift and carryover are systematically controlled.
- Confirmed Lipid Identity with Multiple Transitions
Every reported BMP species passes dual checks: scheduled MRM quant ion + confirmatory qualifier ion, with RT alignment.
- Ready for Interpretation and Statistics
You receive distribution plots, species tables, and matrix-ready output that plugs directly into heatmaps, PCA, or pathway modeling.
- Optional Lipid Context Panel
Add PG, PA, or cardiolipin to distinguish biological vs. analytical lipid shifts in complex endolysosomal samples.
BMP/LBPA Targeted LC–MS/MS Analysis Workflow
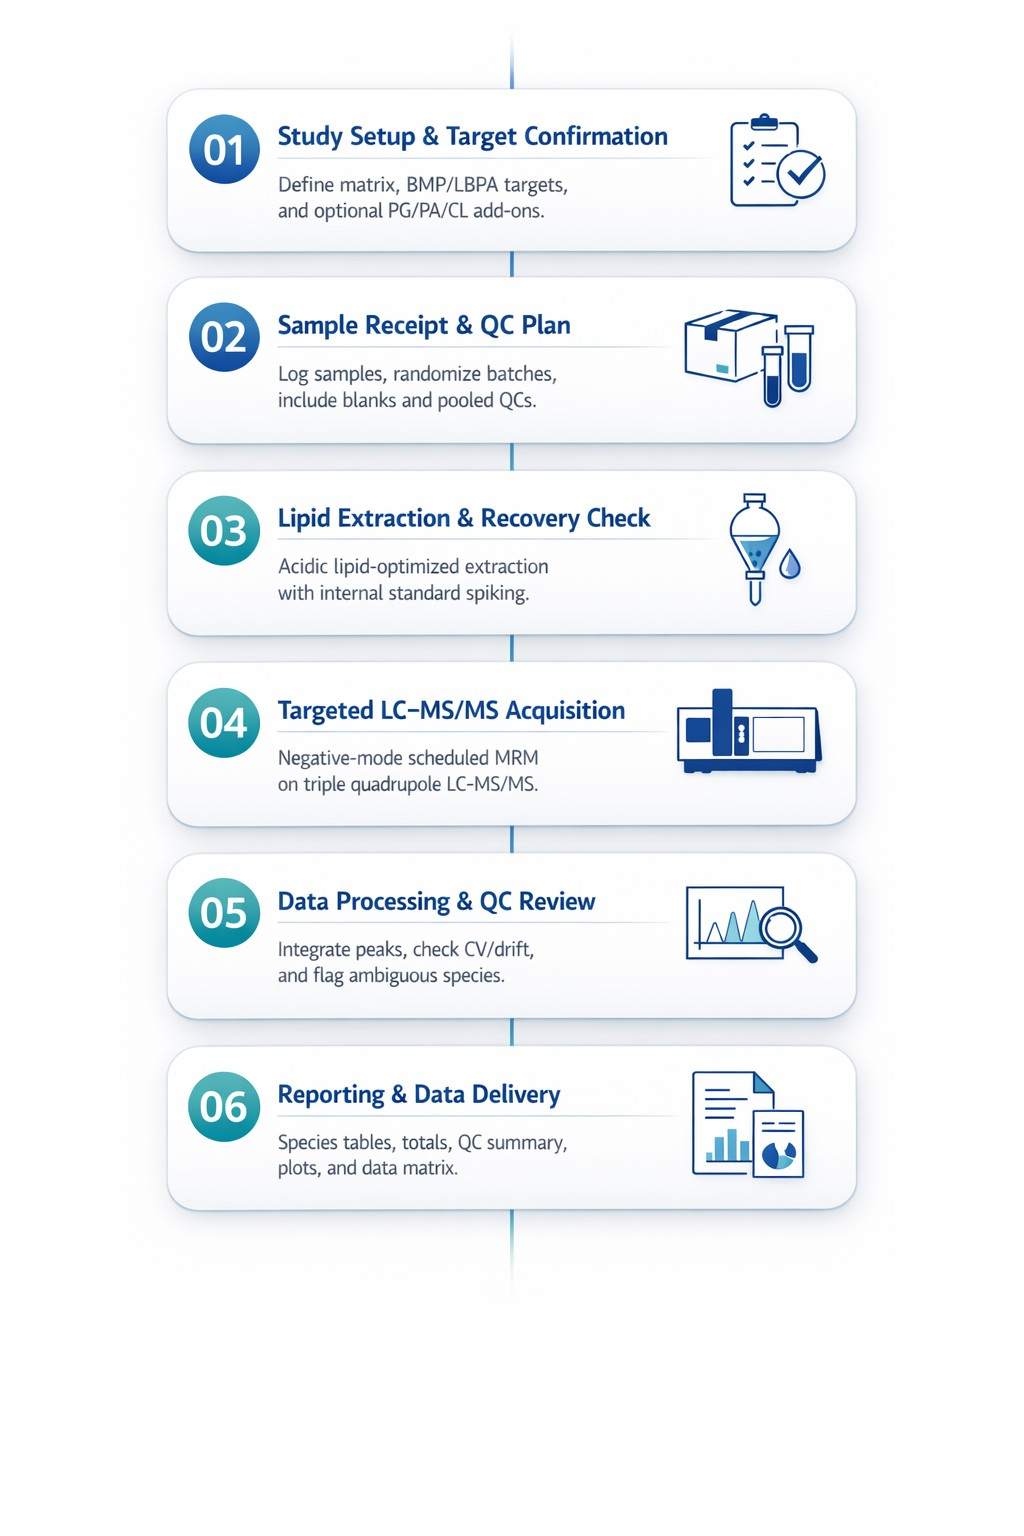
Analytical Methods and Core Instruments for BMP/LBPA Analysis
BMP/LBPA is an acidic, low-abundance lipid class and is best measured by targeted LC–MS/MS. Our standard workflow uses UHPLC separation + triple quadrupole MRM in negative ion mode to deliver species-level, QC-anchored quantification.
Core LC Platform
UHPLC: Thermo Scientific Vanquish UHPLC
- Column format: 2.1 mm ID, sub-2 μm particles (C18-class RP)
- Typical column temperature: 45–60 °C (for stable retention and peak shape)
- Typical run time: 10–20 min per injection (panel-dependent)
Core MS/MS Platform
Triple Quadrupole LC–MS/MS: Thermo Scientific TSQ Altis (or equivalent TSQ triple quad)
- Ionization: ESI negative mode (optimized for anionic phospholipids)
- Acquisition: scheduled MRM (improves dwell time and sensitivity across BMP species)
- Quant strategy: internal-standard–anchored quantification with RT windows and qualifier checks (when applicable)
Key Method Features (what this setup is optimized for)
- Species-level BMP/LBPA reporting (total carbon : total double bonds)
- Isomer-aware monitoring for BMP/LBPA vs. closely related anionic lipids (e.g., PG)
- Batch stability controls (blanks, pooled QCs, drift and carryover monitoring)
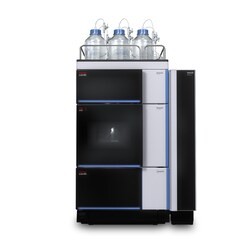
Vanquish UHPLC (Figure from Thermo)
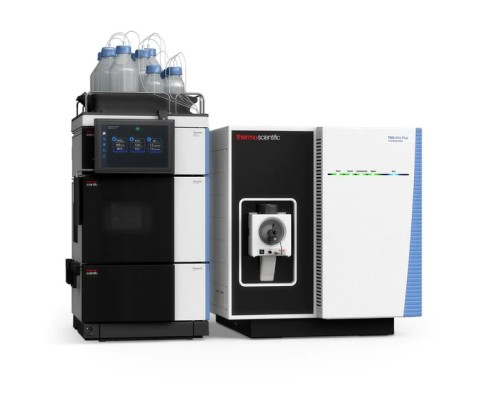
TSQ Altis Triple Quadrupole MS (Figure from Thermo Scientific)
BMP/LBPA Analysis Service: Results and Data Analysis
Standard Deliverables
- BMP/LBPA species results table: species-level reporting (e.g., BMP 36:2) with totals and distribution summaries (as requested: absolute or relative).
- Batch QC summary: blanks, pooled QC performance, internal-standard checks, CV/drift overview, and any flagged features.
- Representative chromatograms: selected MRM/EIC traces for key BMP/LBPA species and QCs to support data transparency.
- Method note (project appendix): sample extraction overview, LC gradient summary, MRM acquisition settings summary, and reporting rules.
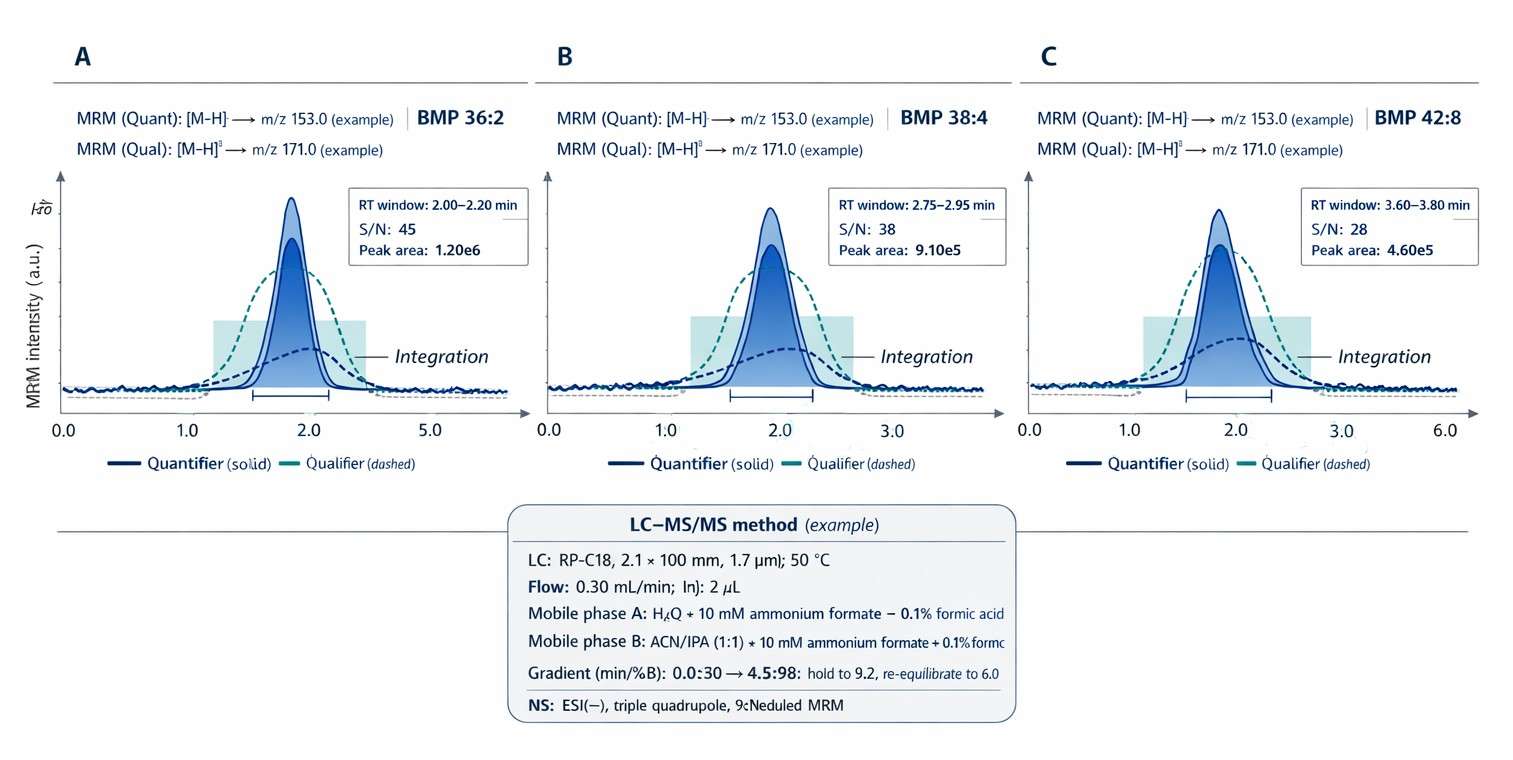
Scheduled-MRM chromatograms for BMP 36:2, BMP 38:4, and BMP 42:8 showing RT-windowed integration and quantifier/qualifier transition confirmation.
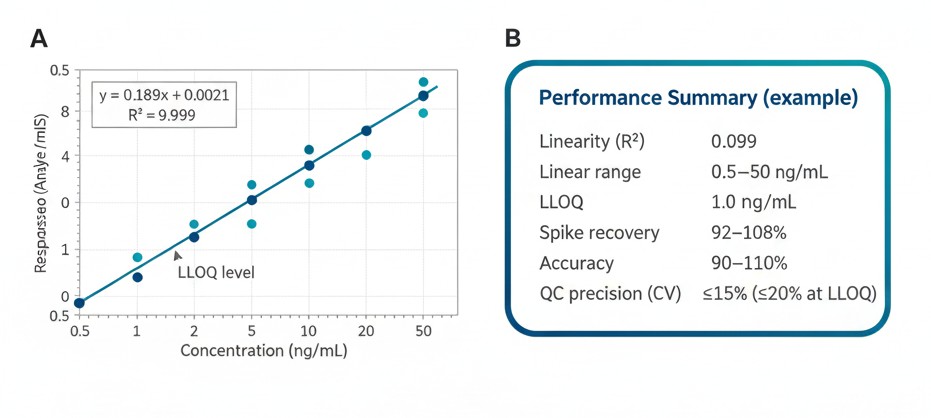
Representative calibration curve with regression equation and R², plus a concise performance summary including linear range, LLOQ/LOQ, recovery/accuracy, and QC precision.
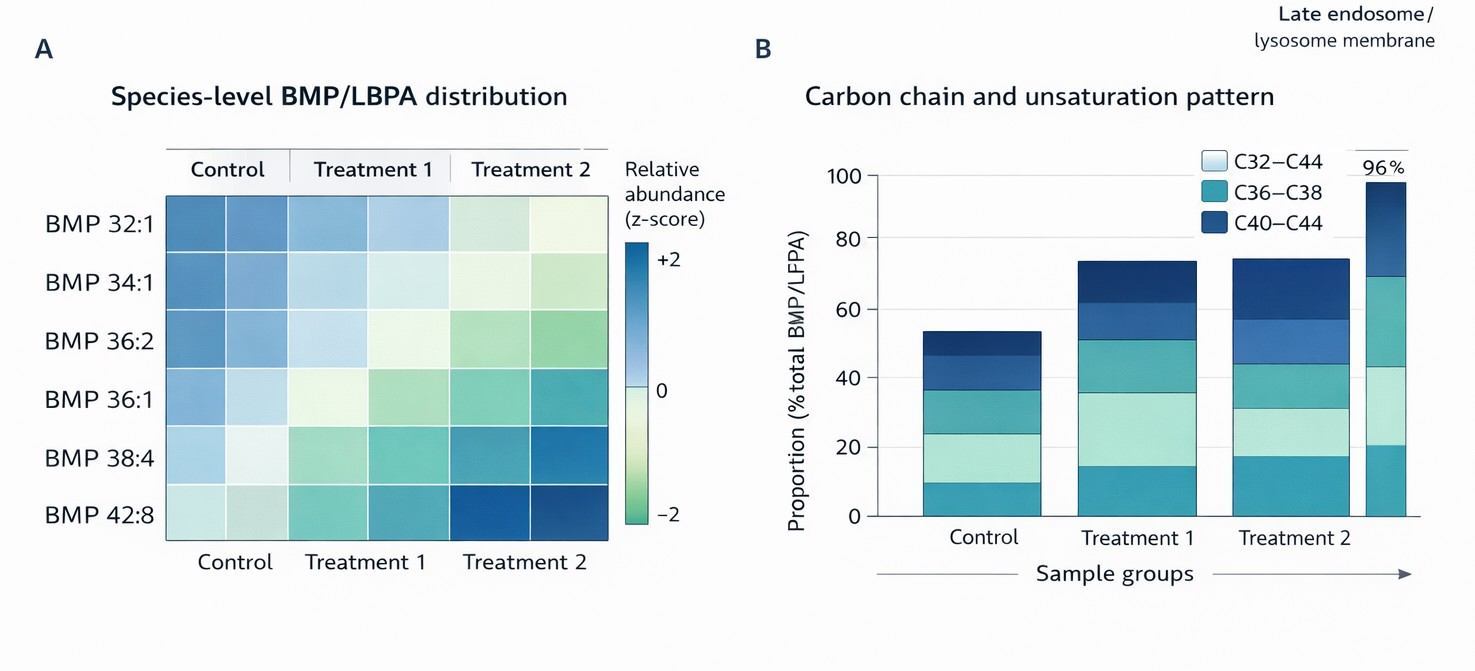
Species-level BMP/LBPA heatmap and carbon-chain distribution plots illustrating group-wise lipid remodeling and biologically interpretable patterns across conditions.
Advanced Data Analysis (Optional)
- Group comparison statistics: fold change tables, significance testing (when study design supports it), and effect-size summaries.
- Multivariate overview: PCA/PLS-DA-style exploratory views and sample clustering QC (only when appropriate).
- Species distribution visualization: class totals, chain-length/unsaturation pattern plots, and condition-driven shifts.
- Cross-panel interpretation (if ordered): integrated interpretation alongside PG/PA/CL or sphingolipid/ganglioside modules to distinguish biological remodeling from analytical overlap.
- Correlation and metadata integration: correlations with phenotypes, treatment dose, genotype, or other omics readouts (user-provided metadata).
Data Formats
- Primary quantitative tables: .xlsx and .csv (species table, totals, QC table).
- Figures and summaries: .pdf (QC summary, plots, selected chromatograms).
- Optional analysis outputs: .pptx (figures for slides) and/or .zip package containing all files organized by sample ID and batch.
Explore our Lipidomics Solutions brochure to learn more about our comprehensive lipidomics analysis platform.
Download Brochure
Applications of BMP/LBPA Profiling
Endolysosomal Biology
Track late endosome/lysosome membrane remodeling and lipid trafficking changes.
Cholesterol Transport Studies
Quantify BMP/LBPA shifts linked to endosomal cholesterol handling and export
Phospholipidosis Screening
Monitor BMP/LBPA as a sensitive readout in cell-based drug stress models.
Neuroscience Models
Profile lysosome-associated lipid remodeling in neuronal and glial systems.
Genetic Perturbation Research
Compare BMP/LBPA species patterns after CRISPR/siRNA modulation of trafficking genes.
Multi-Omics Mechanism Studies
Integrate BMP/LBPA species data with sphingolipids/gangliosides and pathway analytics.
Sample Requirements and Shipping for BMP/LBPA Analysis
BMP/LBPA is usually most informative in cells/tissues or endolysosome-enriched fractions. Biofluids can work, but often require higher input or enrichment due to low abundance.
| Sample type (recommended order) | Recommended amount | Format | Handling | Notes |
|---|
| Cell pellets | ≥ 1–5 × 10⁶ cells | Pellet in low-bind tube | Wash with cold PBS, remove supernatant, snap-freeze | Avoid repeated freeze–thaw; record cell count |
| Tissue | 20–50 mg (more if low-lipid) | Frozen pieces | Snap-freeze in liquid N₂; store at −80 °C | Provide tissue type + wet weight |
| Endolysosome / membrane fractions | As available (protein noted) | Fraction lysate | Freeze immediately; ship on dry ice | Add fractionation notes for interpretation |
| Cultured microbes/yeast (optional) | Equivalent biomass to ≥ 10⁸ cells | Pellet | Snap-freeze; ship on dry ice | Useful if your project is fungal/microbial lipid handling |
| Biofluids (optional) | ≥ 200–500 µL (project-dependent) | Aliquoted | Freeze at −80 °C; ship on dry ice | Often low BMP/LBPA; enrichment may be recommended |
Shipping: dry ice (preferred). Include a simple sample manifest: ID, matrix, group, amount, and freeze date.
FAQs for BMP/LBPA Analysis Service
Why use targeted LC–MS/MS for BMP/LBPA instead of untargeted lipidomics?
Untargeted lipidomics can miss BMP/LBPA because it is low-abundance and can be confused with isomeric anionic lipids (e.g., PG). Targeted LC–MS/MS applies retention-time windows plus qualifier ions to improve specificity and sensitivity.
How do you reduce BMP vs. PG isomer interference?
We combine two checks:
- Chromatographic separation (matrix-optimized RP conditions) to improve BMP/PG resolution.
- Dual-transition confirmation (quantifier + qualifier) with internal-standard–anchored tracking to support confident assignment.
Can BMP/LBPA be quantified in serum or plasma?
Yes, but interpret cautiously. BMP/LBPA is mainly intracellular/lysosomal, so biofluid levels are typically low. We recommend higher input volume and a sensitivity-focused setup for circulating BMP signals.
Do I need to provide internal standards?
No. We spike BMP-class standards or validated surrogates during extraction to control recovery and matrix effects, enabling consistent quantification across batches.
Which BMP species are commonly monitored in lysosomal stress or storage models (RUO)?
Species such as BMP 36:2, 38:4, and 42:8 are frequently tracked as sensitive readouts. Lyso-BMP can be added as an optional module when needed.
How does BMP/LBPA relate to NPC1 and cholesterol efflux (RUO)?
BMP/LBPA is closely linked to late endosome/lysosome membrane remodeling. Changes in BMP/LBPA often coincide with altered endosomal cholesterol handling in NPC-related research models.
What is the difference between BMP and LBPA?
They refer to the same lipid class. LBPA is the historical name; BMP is the structural/class name used widely in lipidomics.
Can cell culture conditions affect BMP/LBPA levels?
Yes. BMP/LBPA can shift with growth conditions and lipid availability. Keep conditions consistent and record cell number / protein content for robust normalization.