Untargeted Spatial Lipid Profiling
Comprehensive, label-free mapping of 300+ phospho-, sphingo-, glycerol- and sterol-lipids in a single run—perfect for discovery and tissue atlas studies.
Creative Proteomics provides advanced MALDI-Imaging Lipidomics services to deliver high-resolution, label-free spatial mapping of over 300 lipid species directly in tissue. We help researchers and biotech teams uncover lipid-based biomarkers, visualize disease progression, and assess drug response—all with precise, in situ molecular imaging. Our services solve the limitations of bulk lipid analysis by offering true spatial context, integrated bioinformatics, and expert support from project design to publication.
Submit Your Request Now
×Our services have earned the trust of companies, schools, and organizations globally, and we remain dedicated to maintaining that trust.


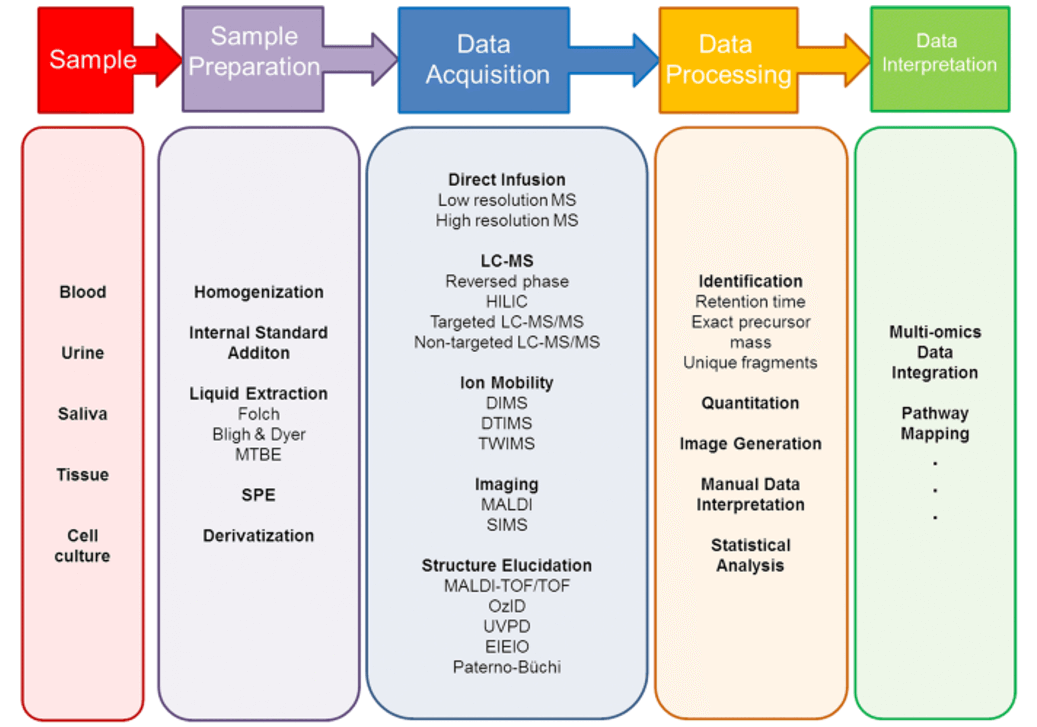
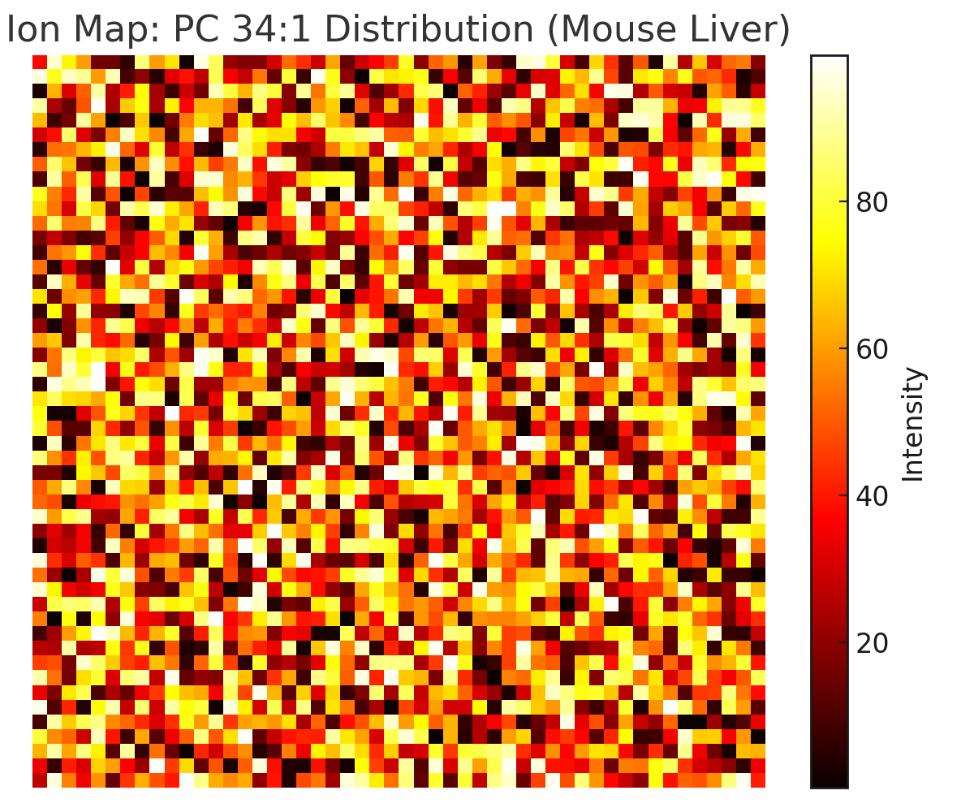
MALDI-Imaging Lipidomics uses Matrix-Assisted Laser Desorption/Ionization Mass Spectrometry Imaging (MALDI-MSI) to map lipid distributions directly within tissue sections—label-free and in situ. Unlike traditional LC-MS, which provides bulk profiles from homogenized samples, MALDI-MSI generates pixel-by-pixel ion maps, producing true molecular heatmaps that reveal both the identity and spatial location of lipid species.
Recent advances—such as high-speed lasers, MALDI-2 post-ionization, and hydrogel-based expansion—have significantly enhanced spatial resolution and sensitivity, making high-resolution lipid imaging routine across diverse applications. This technique complements histology, IHC, and transcriptomics, offering integrated insights into tissue microenvironments, lipid-driven pathologies, and therapeutic responses.

Untargeted Spatial Lipid Profiling
Comprehensive, label-free mapping of 300+ phospho-, sphingo-, glycerol- and sterol-lipids in a single run—perfect for discovery and tissue atlas studies.

Targeted Quantitative Imaging Panels
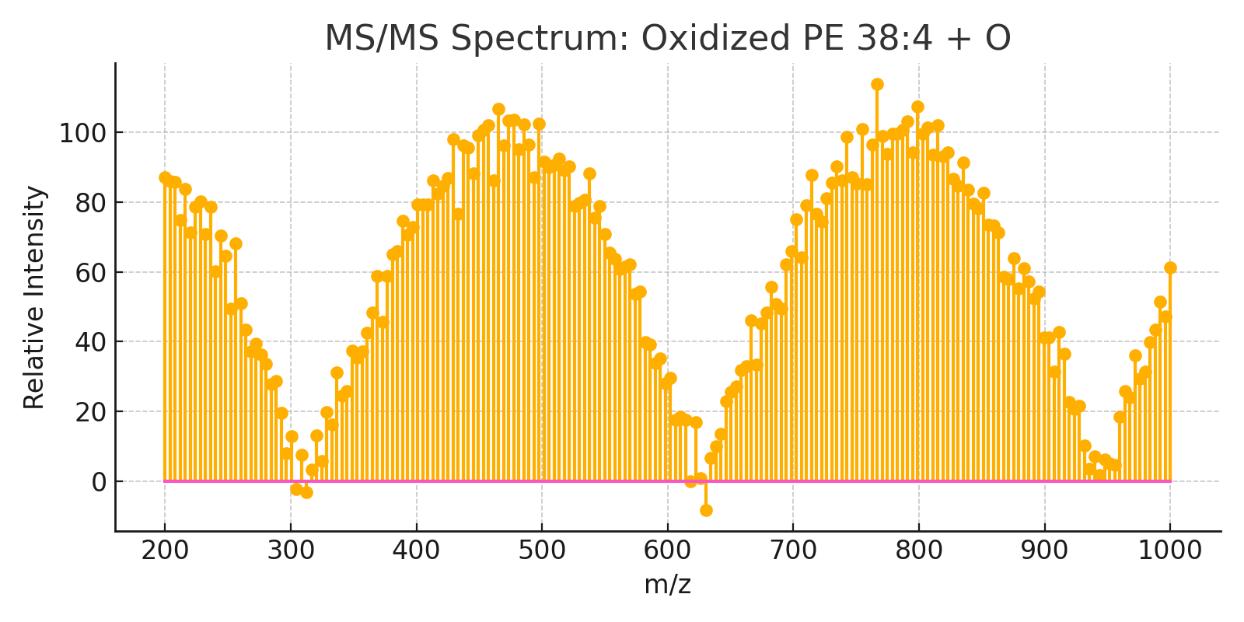
Precise mapping and quantification of user-selected lipid classes (e.g., ceramides, oxidized phosphatidylethanolamines) using isotopically labelled standards.

Ultra-High-Resolution & High-Throughput Acquisition
Pixel sizes down to 5 µm at rates up to 40 pixels/s with MALDI-TOF/TOF or MALDI-Orbitrap; optional hydrogel expansion for sub-micrometer resolution.

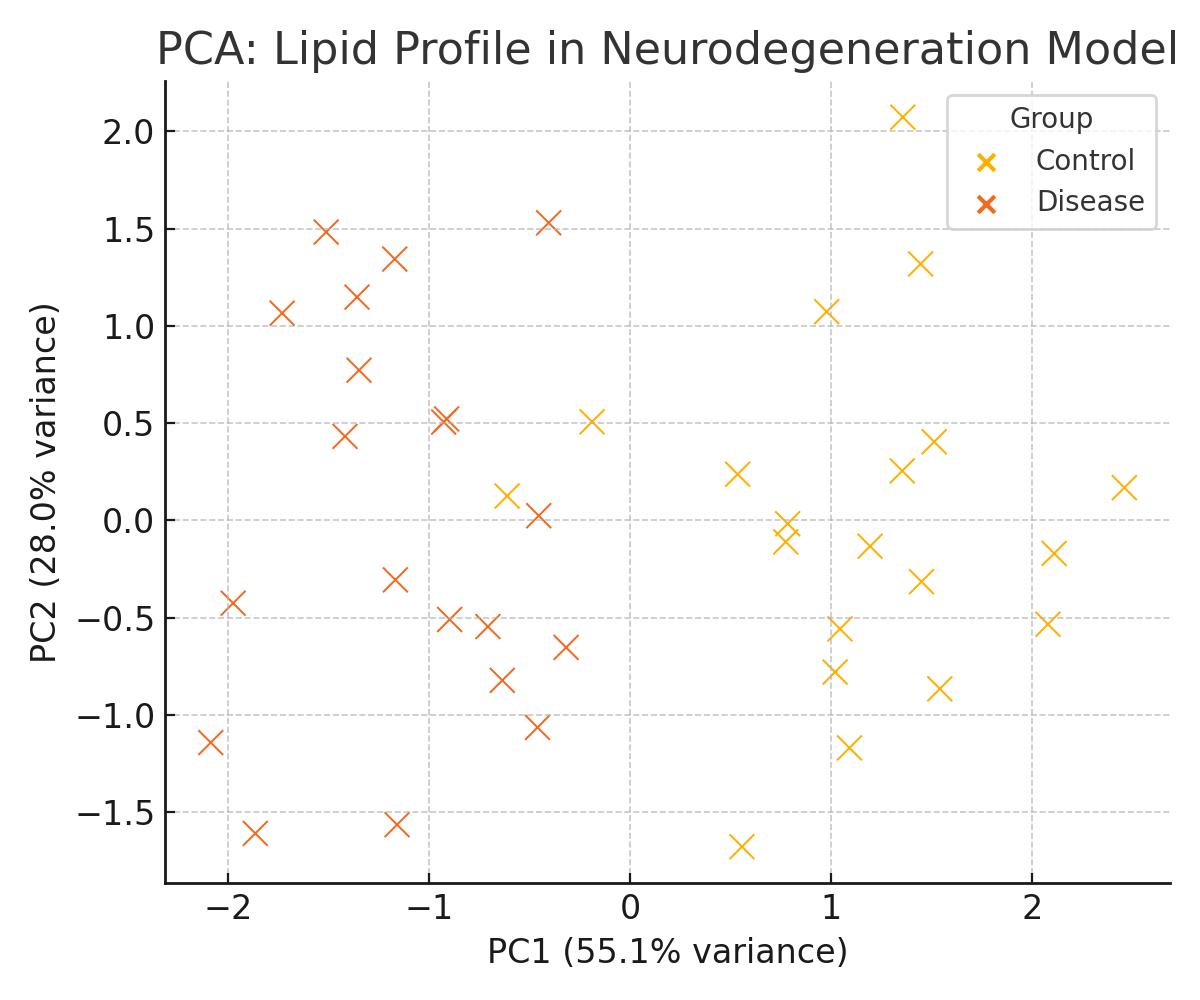
Differential Mapping & Biomarker Discovery
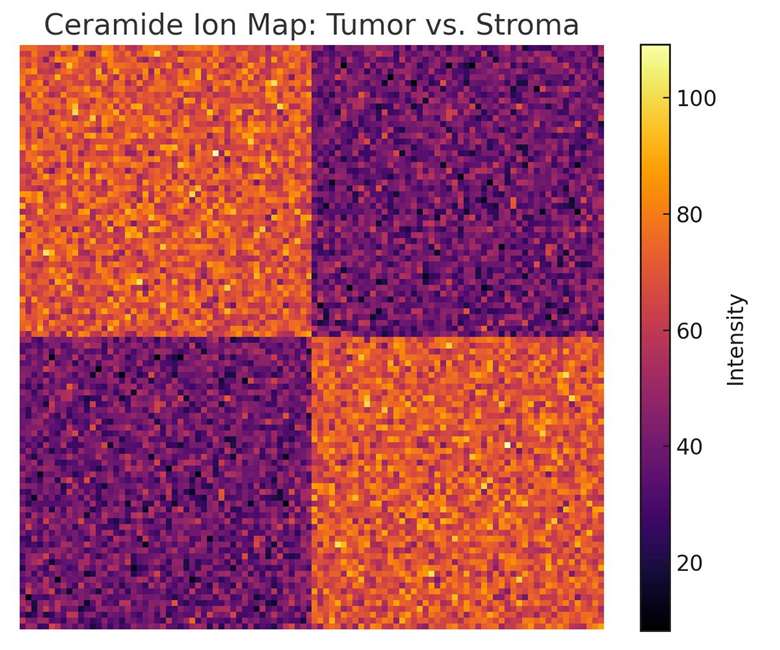
Experimental design, statistical testing, and differential ion heat-maps across treatment groups, time points, or anatomical regions to pinpoint lipid-based biomarkers.

Differential Mapping & Biomarker Discovery
Comparative ion heat-maps across conditions, time points, or anatomical regions, coupled with statistical testing to highlight lipid-based markers.

Multimodal Image Co-Registration
Overlay of lipid maps with histological stains (H&E, IHC, IF) or spatial transcriptomics for integrated, context-rich analysis.

Advanced Spatial Bioinformatics & 3D Visualization
Automated tissue segmentation, pathway enrichment analyses, and optional 3D reconstruction—delivered via a secure client portal with publication-quality graphics.

Custom Sample Preparation & Matrix Optimization
Tailored cryosectioning, matrix choice, and on-tissue derivatization for diverse specimens (e.g., brain, bone, plant tissue, microbial colonies).

Scientific Consultation & Detailed Reporting
Project planning, data interpretation, and manuscript-ready reports provided by our experienced spatial-omics team.
| Subclass | Representative Species | Notes |
|---|---|---|
| Phosphatidylcholine (PC) | PC 34:1, PC 36:2, PC 38:4 | Most abundant and MALDI-detectable in positive ion mode (e.g., [M+H]+, [M+Na]+) |
| Phosphatidylethanolamine (PE) | PE 34:1, PE 36:2, PE 38:4 | Visible in both positive and negative modes; often forms [M-H]⁻ or adducts |
| Phosphatidylinositol (PI) | PI 38:4, PI 36:2 | Strong signals in negative mode |
| Phosphatidylserine (PS) | PS 36:1, PS 38:4 | Requires matrix tuning; observed in negative ion mode |
| Phosphatidic Acid (PA) | PA 34:1, PA 36:2 | Detected in negative mode; may be lower in abundance |
| Lysophosphatidylcholine (Lyso-PC) | Lyso-PC 16:0, Lyso-PC 18:0 | Strong in positive mode; spatial markers of inflammation |
| Subclass | Representative Species | Notes |
|---|---|---|
| Sphingomyelins (SM) | SM d18:1/16:0, SM d18:1/24:1 | Highly abundant; strong in positive ion mode |
| Ceramides (Cer) | Cer d18:1/16:0, Cer d18:1/24:0 | Better detected with MALDI-2 or high-res systems |
| Hexosylceramides (HexCer) | HexCer d18:1/16:0 | Signal weaker; sometimes needs enhanced matrices |
| Sulfatides (ST) | ST 24:1, ST 18:0 | Observed in brain tissue in negative mode |
| Subclass | Representative Species | Notes |
|---|---|---|
| Cholesterol | [Cholesterol + H-H2O]+ (m/z 369.35) | Can be detected with special matrix (e.g., DHB, silver-assisted) |
| Cholesteryl Esters (CE) | CE 18:1, CE 20:4 | Usually low ionization; detectable under optimized conditions |
| Diacylglycerol (DAG) | DAG 36:2, DAG 34:1 | Requires enhanced matrices, MALDI-2 helpful |
| Triacylglycerol (TAG) | TAG 52:3, TAG 54:4 | Weakly ionized; less commonly imaged unless in lipid-rich tissues |
| Fatty Acid | m/z (approx.) | Notes |
|---|---|---|
| Palmitic Acid (C16:0) | m/z 255.23 [M-H]⁻ | Detected in negative mode |
| Stearic Acid (C18:0) | m/z 283.26 | |
| Oleic Acid (C18:1) | m/z 281.25 | |
| Arachidonic Acid (C20:4) | m/z 303.23 | PUFA marker |
| Docosahexaenoic Acid (C22:6) | m/z 327.23 | Brain- and retina-relevant lipid |
| Subclass | Representative Species | Notes |
|---|---|---|
| Lyso-PC | Lyso-PC 16:0, Lyso-PC 18:0 | Detected well in positive mode |
| Lyso-PE | Lyso-PE 18:0, Lyso-PE 20:4 | Detected in negative ion mode |
| Lyso-PI | Lyso-PI 18:0 | Lower intensity; dependent on matrix |
| Subclass | Representative Species | Notes |
|---|---|---|
| Oxidized PE/PC | PE 38:4+O, PC 36:4+O | Markers of oxidative stress; requires sensitive settings |
| N-acyl phosphatidylethanolamines (NAPE) | NAPE 36:2 | Detected in brain; lower abundance |
Bruker rapifleX MALDI-TOF/TOF
High-speed imaging platform for routine lipid distribution mapping with pixel sizes down to 10 µm. Suitable for large-scale sample sets and rapid screening.
Bruker timsTOF fleX with MALDI-2
Advanced platform integrating ion mobility and post-ionization (MALDI-2) for enhanced sensitivity and isomer separation. Ideal for detailed studies of oxidized and low-abundance lipid species.
Thermo Orbitrap Exploris 240 with MALDI Source
High-resolution mass spectrometer offering <3 ppm mass accuracy and MS/MS capability. Used for confident lipid identification and structure validation.
Supporting equipment and tools:
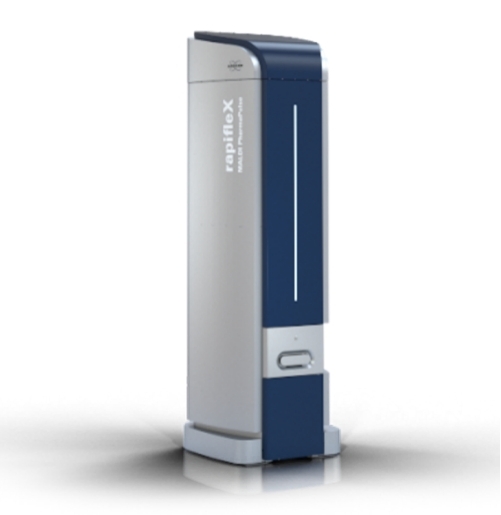
Bruker rapifleX MALDI-TOF/TOF (Figure from Bruker)
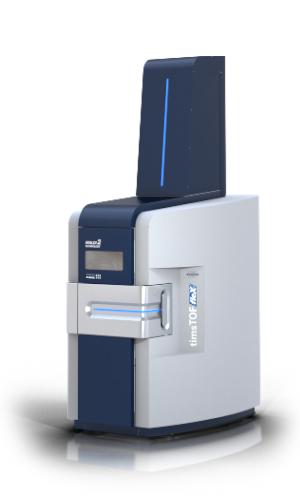
Bruker timsTOF fleX with MALDI-2 (Figure from Bruker)
Thermo Orbitrap Exploris 240 (Figure from Thermo Fisher)

Neuroscience
Visualize region-specific lipid alterations in brain sections related to aging, injury, or neuroinflammation.

ancer Research
Differentiate lipid signatures between tumor core and microenvironment to study metabolic reprogramming.
Metabolic Disease Models
Map lipid accumulation and oxidative lipid stress in tissues affected by obesity or diabetes.

Pharmacology
Evaluate spatial lipid changes in response to drug treatment or compound exposure in preclinical studies.

Plant Biology
Investigate tissue-specific lipid distribution under environmental stress, development, or nutrient deficiency.

Microbial Pathogenesis
Track host lipid remodeling in infected tissues to understand pathogen-host metabolic interactions.
| Sample Type | Recommended Quantity |
|---|---|
| Fresh-frozen tissue | ≥ 1 cm × 1 cm × 3 mm thick (per sample); stored at –80 °C |
| FFPE tissue (optional) | Paraffin block or ≥ 3 unstained slides; provide sectioning details |
| Cryosections on slides | 4–6 serial sections (8–12 μm thick) mounted on ITO-coated conductive slides |
| Adjacent H&E sections | Optional; 1–2 slides for histological correlation and region annotation |
| Blank control slide | 1 matrix-coated slide without tissue (optional, improves background correction) |
| Deuterated lipid standards | Optional; recommended if relative quantification between ROIs is required |
What sample preservation method is best for MALDI imaging?
Snap-freezing in liquid nitrogen followed by storage at –80 °C is strongly recommended. Avoid embedding media like OCT for samples intended for lipid analysis, as they can interfere with ionization.
Can I send pre-sectioned tissue slides for imaging?
Yes, but we recommend using ITO-coated conductive slides and storing them at –80 °C with desiccant to prevent matrix degradation. Please contact us for guidance on slide handling and shipping.
What is the minimum number of biological replicates required?
For meaningful spatial statistical comparisons, at least 3–5 biological replicates per group are recommended. Technical replicates (serial sections) are also helpful for reproducibility.
Is there a recommended tissue size or shape?
We accept tissue blocks up to 1 cm² in area. For irregular samples (e.g., plant roots or tumors), please provide a diagram or orientation guide so we can align analysis with your biological regions of interest.
How long are project data retained?
We securely archive all raw and processed data for at least 12 months. Download links and project reports remain active during this period. Extended storage options are available upon request.
Can I perform additional analysis on the imzML files myself?
Yes. Our data is provided in the open .imzML format, compatible with multiple visualization and analysis tools such as SCiLS Lab, MSiReader, and Cardinal (R). We can also provide usage guides if needed.
Do you support co-analysis with other omics data?
Yes. We frequently integrate spatial lipidomics data with transcriptomics, proteomics, or LC-MS lipidomics for systems-level interpretation. Custom bioinformatics support is available upon request.
Are plant, microbial, or insect tissues compatible with MALDI imaging?
Yes, but they may require protocol adjustments. We have experience handling a range of non-mammalian samples. Please contact us to discuss specific needs and optimization strategies.
Can I preview a demo dataset before starting a project?
Yes. We provide example results from previous imaging studies, including ion maps, MS/MS spectra, and data reports, to help you assess suitability before committing to a full analysis.
Services:
Resource:
Platform:
Online Inquiry
CONTACT US