Ganglioside Analysis Service — LC-MS/MS Quantification of GM1, GM2, GM3, GM4, GD1, GD2, GD3, GT1b & GQ1b

Gangliosides are sialic acid-containing glycosphingolipids that organize lipid rafts and regulate receptor signaling at the cell surface. Their expression is cell-type-specific — GM1 dominates in neurons, GD2 in neuroblastoma, GM3 in peripheral tissues, GM4 in oligodendrocyte myelin — and each ganglioside's abundance changes in disease. Creative Proteomics quantifies 90+ ganglioside species by HILIC LC-MS/MS using the m/z 290 sialic acid fragment as a universal MRM transition, with isomer-level resolution of GD1a/GD1b and GT1a/GT1b, deuterated internal standards per series, and Neu5Ac/Neu5Gc differentiation.

Coverage: 90+ species across GM3, GM2, GM1, GM4, GD3, GD2, GD1a, GD1b, GT3, GT2, GT1b, GQ1b, Fucosyl-GM1, O-acetyl-GD2 — plus GlcCer, LacCer, Gb3, Gb4, GA2, and sulfatides

Key applications: GD2 immunotherapy monitoring · GM1/GM4 neurodegeneration biomarkers · GM3 metabolic disease & insulin resistance · lipid raft composition · lysosomal storage disorder research

Request Analysis

Submit Your Request Now

×

Our services have earned the trust of companies, schools, and organizations globally, and we remain dedicated to maintaining that trust.

Boston University
University at Buffalo
UMass Medical School
Hawaii Pacific University
Medizinische Fakultät
Louisiana State University
Nyulangone
Nature's Fynd
Dietary Supplement Manufacturer
  • Service We Provide
  • Ganglioside Biology
  • Detection Panel
  • Advantages
  • Workflow & Platform
  • Results & Data
  • Sample Requirements
  • FAQ
  • Publication

What Are Gangliosides?

Gangliosides are sialic acid-containing glycosphingolipids concentrated in the outer leaflet of the plasma membrane. Their bulky, negatively charged head groups extend into the extracellular space and organize lipid rafts — cholesterol- and sphingolipid-enriched microdomains that concentrate signaling receptors. This structural position places gangliosides at the interface between the cell and its environment, where they modulate growth factor signaling, mediate cell-cell recognition, and serve as entry receptors for toxins and pathogens.

Each cell type expresses a characteristic ganglioside profile, built stepwise by a series of glycosyltransferases from glucosylceramide. GM3 synthase (ST3GAL5) produces GM3, the precursor for all a-, b-, and c-series gangliosides. GD3 synthase (ST8SIA1) branches the pathway toward the b-series. Because each ganglioside's abundance reflects the activity of a specific glycosyltransferase, measuring the full profile — not just one or two species — reveals which enzyme is driving the change.

Ganglioside Biosynthesis Pathway

A shift in the GM3/GD3 ratio reflects altered ST8SIA1 activity — a key regulatory node in cancer and neural development. The table below maps each ganglioside series to its biosynthetic enzyme and biological context.

SeriesBiosynthetic RouteKey EnzymeSignaturesBiological Context
a-seriesGM3 → GM2 → GM1 → GD1a → GT1aB4GALNT1GM1, GD1aNeuronal membranes, myelin, lipid rafts. GM1 loss in Parkinson's and Huntington's. GM1 binds cholera toxin B and interacts with α-synuclein.
b-seriesGM3 → GD3 → GD2 → GD1b → GT1b → GQ1bST8SIA1GD2, GD3, GT1b, GQ1bGD2: neuroblastoma immunotherapy target (dinutuximab, naxitamab, CAR-T). GD3: mitochondrial apoptosis. GQ1b: neuromuscular junction, Miller Fisher syndrome autoantigen.
c-seriesGT3 → GT2 → GT1c → GQ1c → GP1cST8SIA5GT3, GQ1cEmbryonic/developing brain. Largely absent in adult tissues except certain gliomas.
0-seriesLacCer → GA2 → GA1 → GM1b → GD1cB3GALT4GA1, GM1bMinor pathway. GA1 accumulates in GM1 gangliosidosis (GLB1 deficiency).

Ganglioside Analysis Service in Creative Proteomics

We quantify gangliosides by HILIC LC-MS/MS using the validated m/z 290 sialic acid fragment as a universal MRM transition — a method that achieves attomole sensitivity for every species in a single acquisition and is the consensus approach for ganglioside quantification since Ikeda et al. (2008). HILIC chromatography resolves GD1a from GD1b, GT1a from GT1b, and GM1a from GM1b — structural isomers that produce identical MRM signals on standard reverse-phase columns. Deuterated internal standards (GM3-d3, GM1-d3, GD3-d3, GT1b-d3) correct for the differential extraction efficiency of mono- through tetra-sialylated species. Every report includes Neu5Ac/Neu5Gc differentiation and isomer-level quantification.

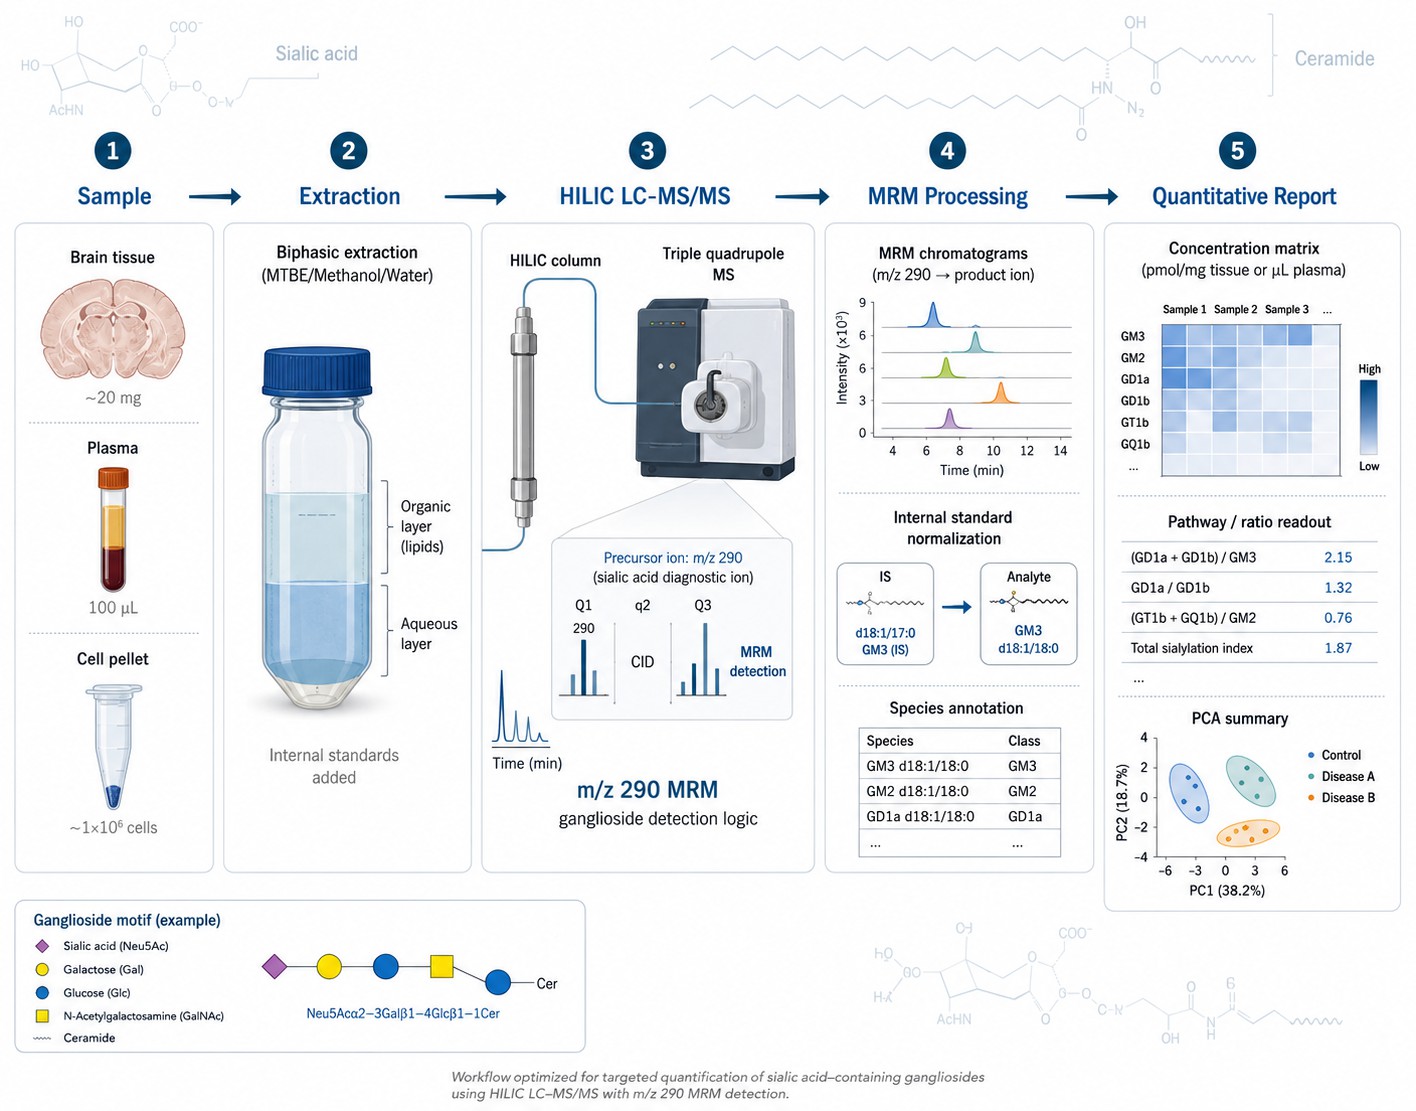
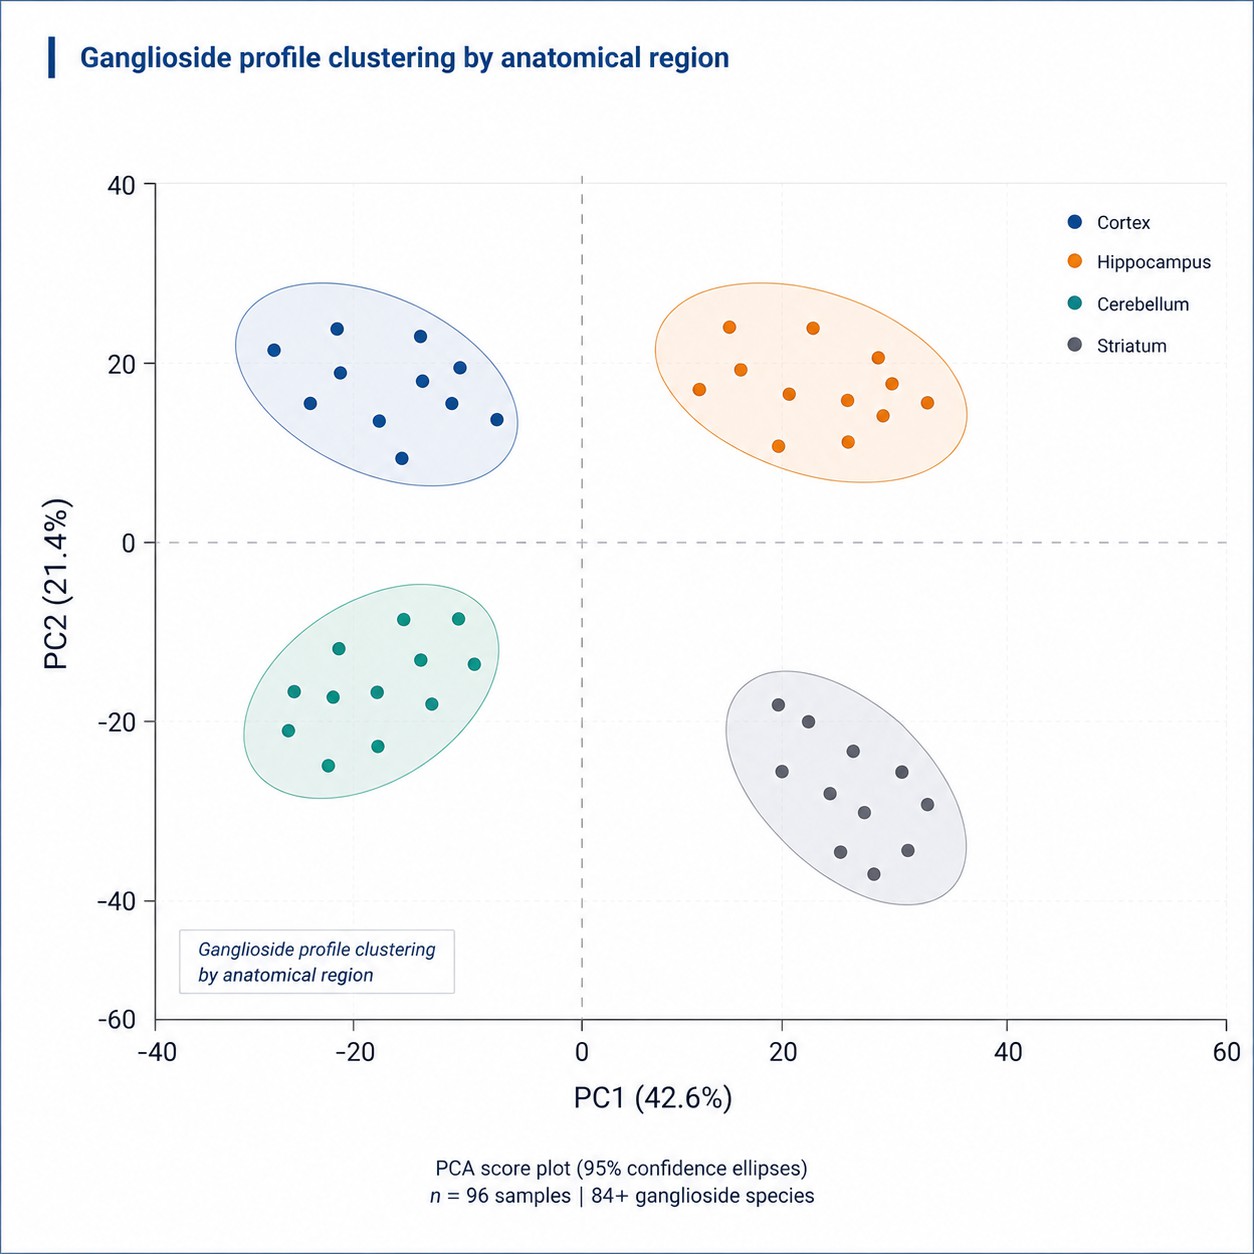
90+ Species Across 4 Ganglioside Series

GM3, GM2, GM1, GM4, GD3, GD2, GD1a, GD1b, GT1b, GQ1b, Fucosyl-GM1, O-acetyl-GD2 — each quantified with ceramide chain-length resolution (d18:1/16:0 through d18:1/24:1). Plus GlcCer, LacCer, Gb3, Gb4, GA2, and sulfatides for pathway-level interpretation.

Isomer-Level Separation by HILIC

GD1a vs GD1b, GT1a vs GT1b, GM1a vs GM1b — separated by HILIC chromatography (XBridge BEH Amide). These isomers share identical MRM transitions on C18 and are misreported as single peaks by labs using reverse-phase alone. Our method quantifies each isomer independently.

Neu5Ac / Neu5Gc Differentiation

MS/MS resolves the 16 Da mass difference between N-acetylneuraminic acid (Neu5Ac, m/z 290 — human) and N-glycolylneuraminic acid (Neu5Gc, m/z 306 — mouse, rat, most mammals). Critical for xenograft models and dietary Neu5Gc incorporation studies.

GD2 Quantification for Immunotherapy Studies

Quantify GD2 expression across ceramide chain lengths in tumor models and xenografts. Track target engagement during anti-GD2 antibody or CAR-T treatment. Detect GD2-negative escape by parallel GD3/GM2 profiling. Also applicable to SCLC, TNBC, and H3K27M glioma models.

GM1, GM4 & Neurodegeneration Biomarkers

Quantify the GM1 d20:1/d18:1 ceramide ratio — an emerging Alzheimer's biomarker that declines in dentate gyrus as amyloid plaques accumulate. GM4, enriched in oligodendrocyte myelin, is elevated in Alzheimer's frontal cortex. All reported with isomer-level resolution across brain regions.

GM3 Quantification for Peripheral Tissues

GM3 is the only ganglioside abundant outside the nervous system — quantify it in plasma, adipose, and skeletal muscle. Track GM3-mediated insulin receptor inhibition in metabolic disease models. Measure NeuGcGM3 as a tumor-specific biomarker. GM3/GD3 ratio included as an ST8SIA1 activity readout.

Ganglioside Detection Panel

  • Ganglioside Series
  • Related Services

Ganglioside Panel — 90+ Species with Attomole LOD

Negative ion LC-MS/MS with scheduled MRM using the universal m/z 290 product ion. Deuterated IS per series: GM3-d3, GM1-d3, GD3-d3, GT1b-d3. Isomer-level HILIC separation. Neu5Ac and Neu5Gc species quantified separately.

SeriesSpeciesCeramide ChainsLOD
GM44d18:1/16:0 – d18:1/24:0265 amol
GM38d18:1/16:0 – d18:1/24:1134 amol
GM26d18:1/16:0 – d18:1/24:0321 amol
GM110d18:1/16:0 – d18:1/24:1298 amol
GD38d18:1/16:0 – d18:1/24:1249 amol
GD26d18:1/16:0 – d18:1/24:0512 amol
GD1a / GD1b12 + 10d18:1/16:0 – d18:1/24:1576 / 420 amol
GT1b10d18:1/16:0 – d18:1/24:1108 amol
GQ1b6d18:1/16:0 – d18:1/24:0210 amol
Fucosyl-GM14d18:1/16:0 – d18:1/24:0450 amol
O-Acetyl GD23d18:1/16:0 – d18:1/24:0580 amol
Sulfatides10d18:1/16:0 – d18:1/24:1180 amol

Related Sphingolipid Services

Why Choose Our Ganglioside Analysis Platform

  • HILIC isomer separation — GD1a/GD1b, GT1a/GT1b resolved by polar headgroup chromatography. Reverse-phase alone cannot distinguish these species, yet they have distinct biological functions and disease associations.
  • m/z 290 universal fragment MRM — the Ikeda (2008) method, validated by SCIEX. Every ganglioside species detected with the same high-sensitivity transition at attomole LOD (134 amol for GM3).
  • Neu5Ac/Neu5Gc differentiation via MS/MS — N-acetyl (human, m/z 290) vs N-glycolyl (non-human, m/z 306) sialic acid forms quantified separately. Essential for xenograft and dietary Neu5Gc studies.
  • Deuterated IS per series — GM3-d3, GM1-d3, GD3-d3, GT1b-d3 spiked pre-extraction correct for the differential extraction efficiency of mono- through tetra-sialylated species.
  • 90+ species in one 20-min HILIC run — complete a-, b-, c-series from GM3 through GQ1b, plus modified gangliosides (Fucosyl-GM1, O-acetyl-GD2) and sulfatides for pathway-level interpretation.
  • Laser microdissection-compatible — brain regional profiling from 5 mg tissue, validated in mouse cerebellum molecular/granular layer dissection.

Ganglioside Analysis Workflow & Instrument Platform

Ganglioside Analysis Workflow

SCIEX Triple Quad 6500+

SCIEX Triple Quad 6500+ — primary MRM quantification using the m/z 290 sialic acid fragment in negative ion mode (Figure from SCIEX).

Thermo Q Exactive HF-X

Thermo Q Exactive HF-X Orbitrap — high-resolution isomer confirmation and intact glycoside profiling at 120,000 resolution (Figure from Thermo Fisher).

LC-MS/MS Method Specifications

ParameterSpecification
PlatformSCIEX Triple Quad 6500+ with Turbo V ion source
Ion ModeNegative ion ESI; universal product ion m/z 290 (dehydrated sialic acid fragment)
AcquisitionScheduled MRM; 2-3 transitions per species
HILIC ColumnXBridge BEH Amide (2.1 × 150 mm, 3.5 μm); ACN/NH4OAc gradient
ISGM3-d3, GM1-d3, GD3-d3, GT1b-d3; proprietary odd-chain standards for uncovered species
PrecisionIntra-assay CV below 8%; inter-assay CV below 18%
Calibration7-point matrix-matched; 1/x2 weighted; r2 ≥ 0.993

Ganglioside Analysis — Results & Data

Ganglioside Quantification Report

Results provided:

  • Absolute concentrations (pmol/mL or pmol/mg protein) per species with ceramide chain-length resolution
  • Sialic acid series ratios (a-series/b-series/c-series); GM3/GD3 ratio as ST8SIA1 activity surrogate
  • IS recovery per sample; calibration curve r2; inter-batch QC metrics
Ganglioside HILIC-MRM chromatogram

HILIC-MRM chromatogram: baseline separation of GM3, GM2, GM1, GD3, GD1a, GD1b, GT1b, and GQ1b with m/z 290 fragment detection.

Ganglioside PCA score plot

PCA score plot: ganglioside profiles across brain regions showing distinct clustering by anatomical origin.

Differential Ganglioside Analysis

  • Volcano plots and heatmaps per species with FDR-corrected significance
  • Ganglioside class enrichment — which series is disproportionately altered
  • Glycosyltransferase activity inference from product/substrate ratios

Pathway & Multi-Omics Integration

  • KEGG glycosphingolipid biosynthesis pathway with fold-change overlay
  • Integration with sphingolipid data — ceramide, sphingomyelin, and ganglioside co-analysis
  • Publication-ready figures (TIFF/PDF, 600 dpi)

Explore our Lipidomics Solutions brochure to learn more about ganglioside analysis and our complete glycosphingolipid profiling capabilities.

Download Brochure

What Ganglioside Analysis Is Used For

GD2 Immunotherapy Research

GD2 is the most clinically validated ganglioside target — dinutuximab and naxitamab are FDA-approved for neuroblastoma, and GD2 CAR-T therapies are in active trials. Quantify tumor GD2 expression across ceramide chain lengths, monitor target engagement, and detect antigen-loss escape variants through parallel GD3 and GM2 profiling. Also expressed in SCLC, TNBC, and H3K27M glioma models.

Neurodegeneration & Brain Regional Profiling

GM1 loss is documented in Parkinson's substantia nigra and Huntington's striatum; GM1 interacts directly with α-synuclein. The GM1 d20:1/d18:1 ceramide ratio — resolvable only by isomer-level LC-MS — is an emerging Alzheimer's biomarker that declines in dentate gyrus as amyloid plaques accumulate. GM4, enriched in oligodendrocyte myelin, is elevated in Alzheimer's frontal cortex. Laser microdissection-compatible for layer-specific brain mapping.

Metabolic Disease & Insulin Resistance

GM3 is the only ganglioside significantly expressed in peripheral tissues including adipose and skeletal muscle. It binds the insulin receptor in lipid rafts — elevated adipocyte GM3 impairs insulin receptor autophosphorylation. Plasma GM3 profiles track with type 2 diabetes and NAFLD progression.

Lipid Raft & Membrane Microdomain Studies

Gangliosides are essential structural components of cholesterol- and sphingolipid-enriched lipid rafts that concentrate signaling receptors at the cell surface. GM1 is the canonical raft marker — its quantification alongside raft-associated receptors (EGFR, TrkA, insulin receptor) maps membrane domain composition at molecular species resolution.

Lysosomal Storage Disorders

GM1 gangliosidosis (GLB1 deficiency), Tay-Sachs (HEXA), Sandhoff disease (HEXB), and GM3 synthase deficiency each produce characteristic ganglioside accumulation patterns. Multi-species panels distinguish biochemically similar disorders and track substrate reduction in gene therapy efficacy studies.

Sample Requirements for Ganglioside Analysis

Sample TypeMinimumNotes
Brain Tissue5–50 mgSnap-freeze in LN2 within 30 s. Record anatomical origin — ganglioside composition differs by brain region. Laser microdissection-compatible. Perfuse with ice-cold PBS before freezing.
Plasma / Serum100–200 μLEDTA plasma preferred. Ganglioside concentrations are 100-1,000× lower than brain — larger volumes improve detection of GT1b and GQ1b.
CSF500 μL–1 mLPolypropylene tubes. CSF ganglioside profiles reflect CNS parenchymal turnover. GM1 and GD1a are the dominant CSF species.
Cell Pellets1–5 × 10⁶ cellsWash 2× with ice-cold PBS. For GD2-positive tumor lines, record passage number — GD2 expression can drift with extended culture.
Tumor Biopsy10–30 mgSnap-freeze immediately. Record tumor type and grade. Adjacent H&E section recommended for tumor content estimation.

FAQ — Ganglioside Targeted Lipidomics

What is the m/z 290 method?

In negative ion ESI, all gangliosides fragment to a common dehydrated sialic acid ion at m/z 290. Using this as a universal MRM product ion — the method established by Ikeda et al. (2008) — provides attomole sensitivity (134 amol for GM3) for every ganglioside species in a single acquisition.

Can you separate GD1a from GD1b and GT1a from GT1b?

Yes. HILIC chromatography (XBridge BEH Amide) resolves these structural isomers that co-elute on standard C18. GD1a elutes before GD1b, GT1a before GT1b. Isomer-level quantification is standard in every report.

Can you distinguish Neu5Ac from Neu5Gc gangliosides?

Yes. MS/MS resolves the 16 Da mass difference: m/z 290 for Neu5Ac (human), m/z 306 for Neu5Gc (mouse, rat, most mammals). Essential for non-human model studies and dietary Neu5Gc incorporation research.

What gangliosides are most abundant in plasma vs brain?

Plasma: GM3 dominates (~60%), GD3 and GM2 follow. GM1 is ~60 fmol — ~100× lower than GM3. Brain: GM1, GD1a, GD1b, GT1b at nmol/g. GQ1b enriched at neuromuscular junctions. Recommend ≥150 μL plasma for full profiling.

Is this service for clinical diagnostic use?

No. Our ganglioside analysis service is for research use only (RUO). It supports preclinical and translational research — cancer biomarker studies, neurobiology research, and drug development — not clinical diagnostics.

Can you quantify gangliosides in laser-microdissected brain regions?

Yes — our protocol is validated for tissue as low as 5 mg, compatible with LMD samples from cerebellar molecular/granular layers, hippocampal subfields, and cortical layers. We recommend pooling 3-5 sections per region with a pre-extraction IS spike protocol optimized for small volumes.

How does your approach compare to shotgun lipidomics?

Shotgun (direct infusion) cannot resolve GD1a from GD1b — they share the same precursor ion. Our HILIC LC-MS/MS MRM separates isomers before detection, giving isomer-level quantification unavailable from shotgun methods. The m/z 290 fragment provides attomole sensitivity exceeding shotgun for low-abundance plasma and CSF species.

Can you detect Fucosyl-GM1, O-acetyl-GD2, and GQ1b?

Yes — all three are in our extended panel with specific MRM transitions. Fucosyl-GM1 is a SCLC tumor antigen (BMS-986012 in trials). O-acetyl-GD2 is a tumor-selective GD2 variant absent from peripheral nerves. GQ1b is the Miller Fisher syndrome autoantigen at neuromuscular junctions.

Publications

References

  1. Ikeda, K., et al. "Targeted analysis of ganglioside and sulfatide molecular species by LC/ESI-MS/MS with theoretically expanded multiple reaction monitoring." Journal of Lipid Research (2008). https://doi.org/10.1194/jlr.D800038-JLR200
  2. Li, Z. & Zhang, Q. "Ganglioside isomer analysis using ion polarity switching liquid chromatography-tandem mass spectrometry." Analytical and Bioanalytical Chemistry (2021). https://doi.org/10.1007/s00216-021-03262-2
  3. Huang, Q., et al. "Quantification of monosialogangliosides in human plasma through chemical derivatization for signal enhancement in LC-ESI-MS." Analytica Chimica Acta (2016). https://doi.org/10.1016/j.aca.2016.04.043
  4. Svennerholm, L. "The gangliosides." Journal of Lipid Research (1964).
* Our services can only be used for research purposes and Not for clinical use.

Services:

Resource:

Platform:


Online Inquiry

CONTACT US

Copyright © 2026 Creative Proteomics. All rights reserved.